
Using ESMFold to predict Cystic Fibrosis outcomes
Executive summary
Embeddings from the ESMFold model can be used to predict clinical outcomes for different Cystic Fibrosis (CF) genotypes found in the CFTR2 database. The predictive correlation is both non-trivial and statistically significant. This work goes beyond the usual pathogenic/benign distinction and seeks to estimate average clinical outcomes for key CF-related phenotypes (sweat chloride, pancreatic insufficiency, and infection rates).
A summary of this post and the paper is as follows:
- There is substantial variation in (average) clinical outcomes: between mutations, within mutations, between categories, and within categories. Therefore, any ML model needs to be able to predict multiple labels to capture the different aspects of a CF mutation’s pathogenicity.
- Using an off-the-shelf ML model trained on protein folding embeddings from ESMFold obtains statistically significant and non-trivial improvement in rank correlations between the predicted and actual clinical values for a range of categories and labels (see Figure 12A and Figure 12B).
- ML models improve rank correlation by up to 22 percentage points (pp) for Pseudomonas infection rate, 35pp for pancreatic insufficiency, and 27pp for sweat chloride levels compared to a simple model which uses only the amino acid length (see Figure 14). The overall level of correlation ranges from 16-51%.
- No predictive performance was found for multiple measure of lung function.
- Access to more of the underlying clinical information, additional computational power, and additional processing could double the effective sample size.
- Using ML models trained exclusively on CFTR structural forms and clinical outcome categories (sweat chloride, pancreatic function, infection rates) could establish CF-specific pathogenicity scores that go beyond the usual dichotomous predictions of existing tool. There are >1000 CFTR-gene mutations found in the CFTR1 database which do not have an established significance in the CFTR2 database.
The repo used to generate all analyses and figures can be found here: cftr2_esmfold.
The rest of this post is structured as follows: Section 1 gives a background on CF as a disase, Section 2 provides a summary of the ESMFold model used to extract the latent protein representations (along with a literature review subsection), Section 3 describes the CFTR2 database used to extract the clinical information (phenotypes) for different CF mutations, Section 4 outlines the processing pipeline, Section 5 describes how the feature and label matrices were constructed, Section 6 provides model performance results, and Section 7 concludes.
(1) Background on Cystic Fibrosis
Cystic fibrosis (CF) is a rare autosomal recessive genetic disease that can result in a progressive deterioration of organ function, most notably in the lungs and pancreas. Patients with severe CF symptoms can have trouble breathing due to thick and sticky mucus in their lungs. This mucus also increases the risk of infections, which overtime can lead to pulmonary fibrosis (the scarring of the lungs). CF patients that are pancreatic insufficient are unable to effectively absorb nutrients and energy from food leading to weight loss a further deterioration in health. Most CF patients that die of their disease do so because of end-stage obstructive lung disease (90%). The Caucasian population is most at risk of CF, although other groups are still at risk (and likely at a higher rate the official numbers would suggest due to under reporting).
The disease’s etiology is caused by mutations to the cystic fibrosis transmembrane conductance regulator (CFTR) gene which cause an alteration in the chloride and bicarbonate transport channel regulated by cyclic adenosine monophosphate (cAMP). This can lead to a pathological build up of mucus in the organs, with the most deleterious impact being on the lungs and the pancreas. As of March 20th, 2023, a total of 2114 mutations have been discovered on the CFTR gene, with 401 of those being identified as CF-causing. The most common mutation is F508del (aka c.1521_1523delCTT, aka p.Phe508del), which is present in 82% of the CF population.
Unlike some of the false hype and superlatives we see in other branches of medicine, the treatment and survival of CF patients have remarkably changed in recent history. Historically, before the use of antibiotics, patients with CF were unlikely to live past their teens since their lung infections could not be treated. As of 2019, the median life expectancy of CF patients in the United States was 48 years, although there is a range of about 10 years across wealthy countries. For example, Canada is a world leader in CF life expectancy (mid-50s). However, the last decade has been a game changer for pharmaceutical-based treatments of CF.
Modern CF-treating drugs rely on a mechanism of action which increases the flow of sodium and chloride ions across the cell membrane to maintain a proper fluid balance. The current state-of-the-art treatment, known as Trikafta, is a combination of three small-molecule different drugs: Ivacaftor, Elexacaftor, and Tezacaftor. The first, Ivacaftor, which is a CFTR channel potentiator, binds to the CFTR protein and increases its ability to open chloride channels. The other two are CFTR correctors, which help the protein form the right 3D shape.
A recent Canadian study estimated that Trikafta could improve the median age of survival by more than 9 years, a stunning improvement given that CF life expectancy in Canada is already amongst the highest in the world. An amazing Op-Ed in the NYT summarizes the cultural impact these improvement have had on the CF community, with many now living much longer than they had expected. Another stunning announcement was that kids with CF will no longer automatically qualify with the Make-A-Wish foundation in 2024, “Given the ongoing life-changing advances in cystic fibrosis research and treatment.” While the CF community, researchers, and pharmaceutical industry are rightly proud of these accomplishments, CF is still a critical illness, with significant variation between patients. Even with the advent of Trikafta, around 20% of patients with CF in Canada will not make it past their 40th birthday (see study at top of paragraph).
(2) Background on ESMFold and the protein folding problem
Mutations to the exonic (protein-coding) region of the CFTR gene can have disease-causing properties because they can alter the amino acid sequence of the gene.[1] For example, patients with the F508del mutation are missing three DNA codons which code for the phenylalanine amino acid. Even though the other 1479 amino acids in the gene match the wildtype protein, the absence of this critical amino acid impacts the ability of the different CFTR protein domains (structurally distinct parts of the protein) from coming together. The F508del-CFTR gene is sufficiently degraded in structure that the cell’s native proteasome machinery will “throw out” the protein before it can make its way to the cell surface and do its work vis-a-vis chloride channels.
The key takeaway of structural biology is that function follows form at the molecular level. This means that the 3-dimensional structure of a protein determines whether the proteins will be able to carry out its function. In contrast, the information that encodes the protein is linear. Regions of the DNA known as exons are converted to mRNA (a 1-to-1 mapping), and then to amino acids (a many-to-one mapping). Proteins are made up of amino acids. There is a deterministic relationship between a sequence of DNA which is transcribed and the sequence of amino acids that will be strung together to form a protein. What is not known a priori is how that sequence of amino acids will fold in 3-dimensional space and what structure it will take up. This is often referred to as the “protein folding problem.”
The fact that an unfolded sequence of amino acids (or polypeptides) almost always folds to the “correct” shape is somewhat astounding given the astronomical number of combinations in which a protein could fold (see Levinthal’s paradox). How exactly proteins do this is still an area of active research, but it is generally understood that proteins fold in a way which minimizes free energy (see Anfinsen’s dogma). This hypothesis explains why proteins (tend) to fold the same way every time, since they fold in a way which minimizes some optimization problem.
If we understood exactly why proteins fold the way they do, then we could predict how they would fold. Yet even if we cannot understand the physical mechanism by which this happens, simply being able to predict the 3D shape is useful in and of itself. For example, F508del shows us that knowing the physical shape of the protein helps to explain its key pathologies.
Enter AlphaFold, a deep learning algorithm which predicts the 3D structure of a protein using a sequence of amino acids as an input. AlphaFold (2018) and AlphaFold2 (2020) were both able to blow their competitors out of the water at the 2018 and 2020 Critical Assessment of Structure Prediction (CASP) competition. While the claim by some that AlphaFold2 “solved” the protein folding problem is of course erroneous, it nevertheless has proven to be a ground-breaking and powerful tool for researchers. As McBride et al. (2022) put it:
AF2 can clearly predict global structure, yet we do not know whether it is sensitive enough to detect small, local effects of single mutations. Even if AF2 achieves high accuracy, the effect of a mutation may be small compared to the inherent conformational dynamics of the protein – predicting static structures may not be particularly informative. Furthermore, as accuracy improves, evaluating the quality of predictions becomes increasingly complicated by the inherent noise in experimental measurements.
Indeed, two articles (see Pak et al. (2023) and Buel & Walters (2022)) suggest that AlphaFold’s output have limited correlation for predicting the impact of mutations relative to the wildtype. And while McBride and other papers find different results, there is clearly an opportunity for more research to determine when these protein folding models can provide insight on the effects of small mutations.
One element of the AlphaFold secret sauce was the use of “multiple sequence alignments” (MSAs) which compare an input amino acid sequence to a database of known sequences across species. The idea behind using this information is that while the amino acid sequence for the same gene across species may vary, the protein shape itself should be similar. In case of CFTR, we should expect this core chloride channel function to be preserved for humans as much as it is for mice, giraffes, or any other mammal with lungs and a pancreas, since evolution would not tolerate mutations which lead to a protein shape that could not facilitate ion crossing. The problem with using deep learning systems based on MSAs is that while they might tell you what a normal shape should be, they could be less helpful for abnormal shapes. Furthermore, running the MSA algorithm can add hours to inference.
An alternative to AlphaFold is Meta’s ESMFold, which was trained using self-supervised learning techniques from natural language processing (basically given a truncated real amino acid sequence predict the next amino acid). One advantage of this algorithm is that it can be run much faster and (presumably) its key information can be found in its internal representations (also referred to as embeddings).
Existing literature
There are a substantial number of bioinformatics tools for predicting the pathogenicity of mutations (see SIFT 4G, Polyphen-2, PROVEAN and FATHMM). These tools usually fall into one of three categories: i) sequence based tools, ii) structure based tools, or iii) dynamics based tools. There is an equally large literature on how to stack these tools to improve performance (see Lai et al. (2021); Ioannidis et al. (2016) for examples).
As most pathogenic mutations appear to affect protein stability (see Wang and Moult (2001)), protein folding models may be able to produce useful signals for predicting disease severity. Even in the pre-AlphaFold era, classifiers that took into account 3D structures showed some success (see Adzhubei et al., 2010; Capriotti and Altman, 2011). Schmidt et al. (2022) has shown that an ML model trained on AlphaFold features (referred to as AlphaScore in the paper) improved the accuracy of pathogenicity predictions when combined with other tools. However this finding has not been universal (see Pak et al. (2023) and Buel & Walters (2022)).
The use of existing tools for predicting the pathogenicity of missense mutations on the CFTR gene has been mixed, with Niroula & Vihinen (2017) showing relatively high sensitivity and specificity, whilst Michels et al. (2019) found less accurate results when using a larger sample of CFTR mutations. Earlier work by Masica et al. (2012) showed that CFTR-specific phenotype-optimized sequence ensembles (POSEs) could outperform off-the-shelf sequence based tools.
Rychkova et al. (2017) used a CFTR-specific approach by combining 35 different features ranging from existing bioinformatics tools to CFTR-specific protein information. The paper also showed that the predicted pathogenicity probability was correlated to both chloride conductance and sweat chloride levels using data from from Sosnay et al. (2013) and the Stanford CF Center (see Figure 4 in their paper). Only patients heterozygous for F508del mutation were included. As far as this author knows, this is the only paper in the CF literature that explicitly correlates mutational pathogenicity generated from a model to CF-specific clinical outcomes.
Bahia et al. (2021) used two deep learning models (FoldX and Rosetta) to predict domain stability on NBD1 and NBD2 of the CFTR gene and partial alignment to experimental results. However the paper looked at a small number of mutations (59) and did not link this to any clinical outcomes. Like Rychkova et al. (2017), this analysis correlates a predicted measure to a level of clinical severity, but uses a deep learning based structural model like Bahia et al. (2021) to obtain mutation-based features.
The results of the analysis stand out from the existing literature in three ways. First, it considers multiple clinical outcomes types (e.g. not only sweat chloride) and label constructions (e.g. not only F508del heterozygotes). Second, the model is fine-tuned to make predictions directly on CF-specific clinical outcomes rather than binary/ordinal pathogenicity categorizations. Third, by using the embeddings from the ESMFold model, the ML model is able to make predictions for multiple mutation types including insertions, deletions, and duplications, rather than just missense mutations as is done in most of the literature.
(3) CFTR2 database
As a disease, CF is relatively lucky in that it is sufficiently uncommon to be a classified as a “rare disease”, which bestows upon it certain tax and research benefits, but also sufficiently prevalent that it has been able to be extensively studied, with its genotypical variation categorized for many variants.[2] Put another way, CF is a common rare disease.[3] In fact, it is the most common lethal autosomal recessive disorder in the Caucasian population and the fifth most common rare disease by some measures.
Until 2010 the CFTR1 database, maintained by the Cystic Fibrosis Centre at the Hospital for Sick Children in Toronto, kept track on the various mutations on the gene. In 2010, an international initiative led by the US-based Cystic Fibrosis Foundation and John Hopkins University set up CFTR2. This database currently provides two very useful pieces of information to researches:
- An up-to-date list of established CF-causing mutations (402)
- Phenotypic averages for different genotype combinations (for both single and two-variant combinations)
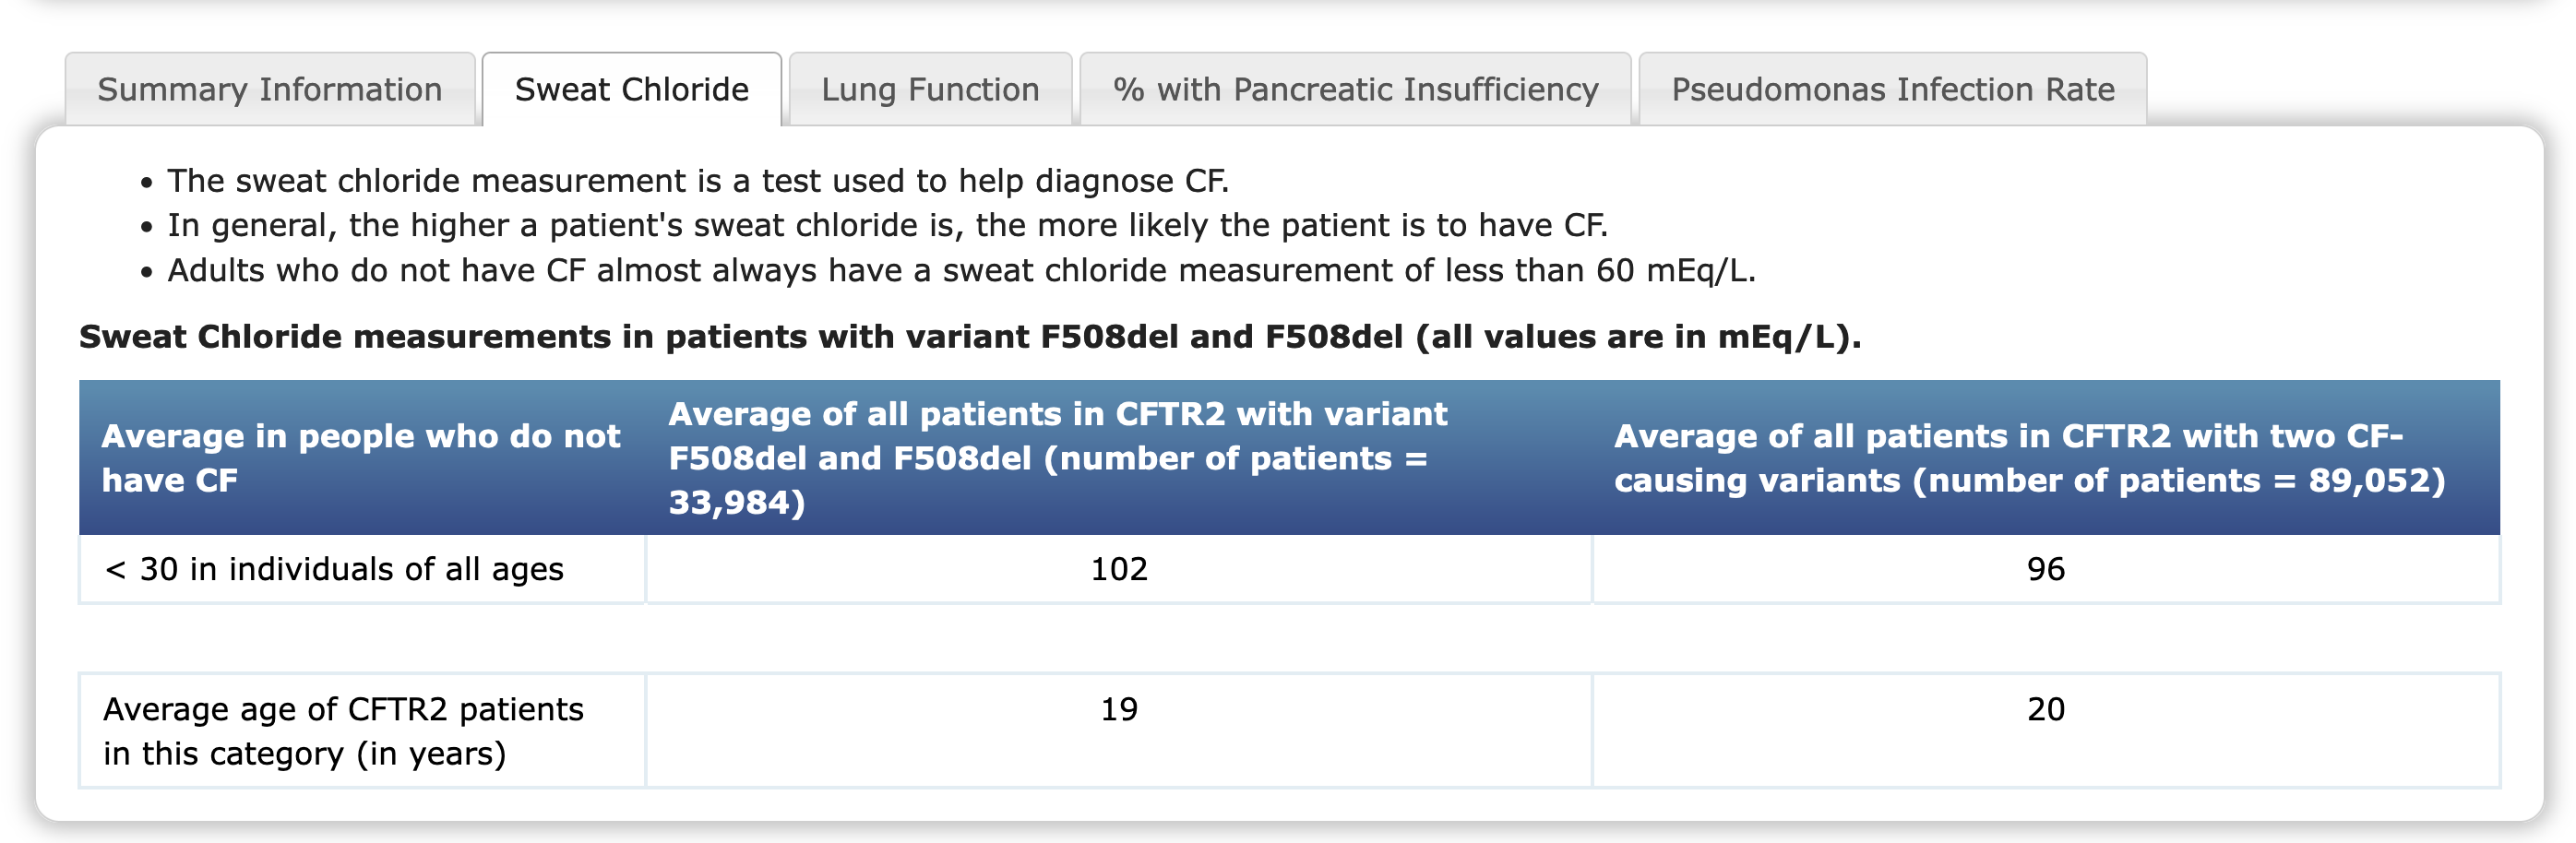
The website makes it clear that it “should not be used to predict the clinical course of individual patients.” As of March 20th, 2023, the CFTR2 database had data on 89,052 patients, and phenotypical information for i) sweat chloride measurement (mEq/L), ii) lung function (FEV1% = Forced Expiratory) for three age ranges (<10, 10-20, and 20+), iii) % of patients with pancreatic insufficiency, and iv) % of patients who have had a Pseudomonas infection. The image below shows an example of the CFTR2 database for a homozygous F508del genotype.
Example of CFTR2 page for F508-F508 genotype
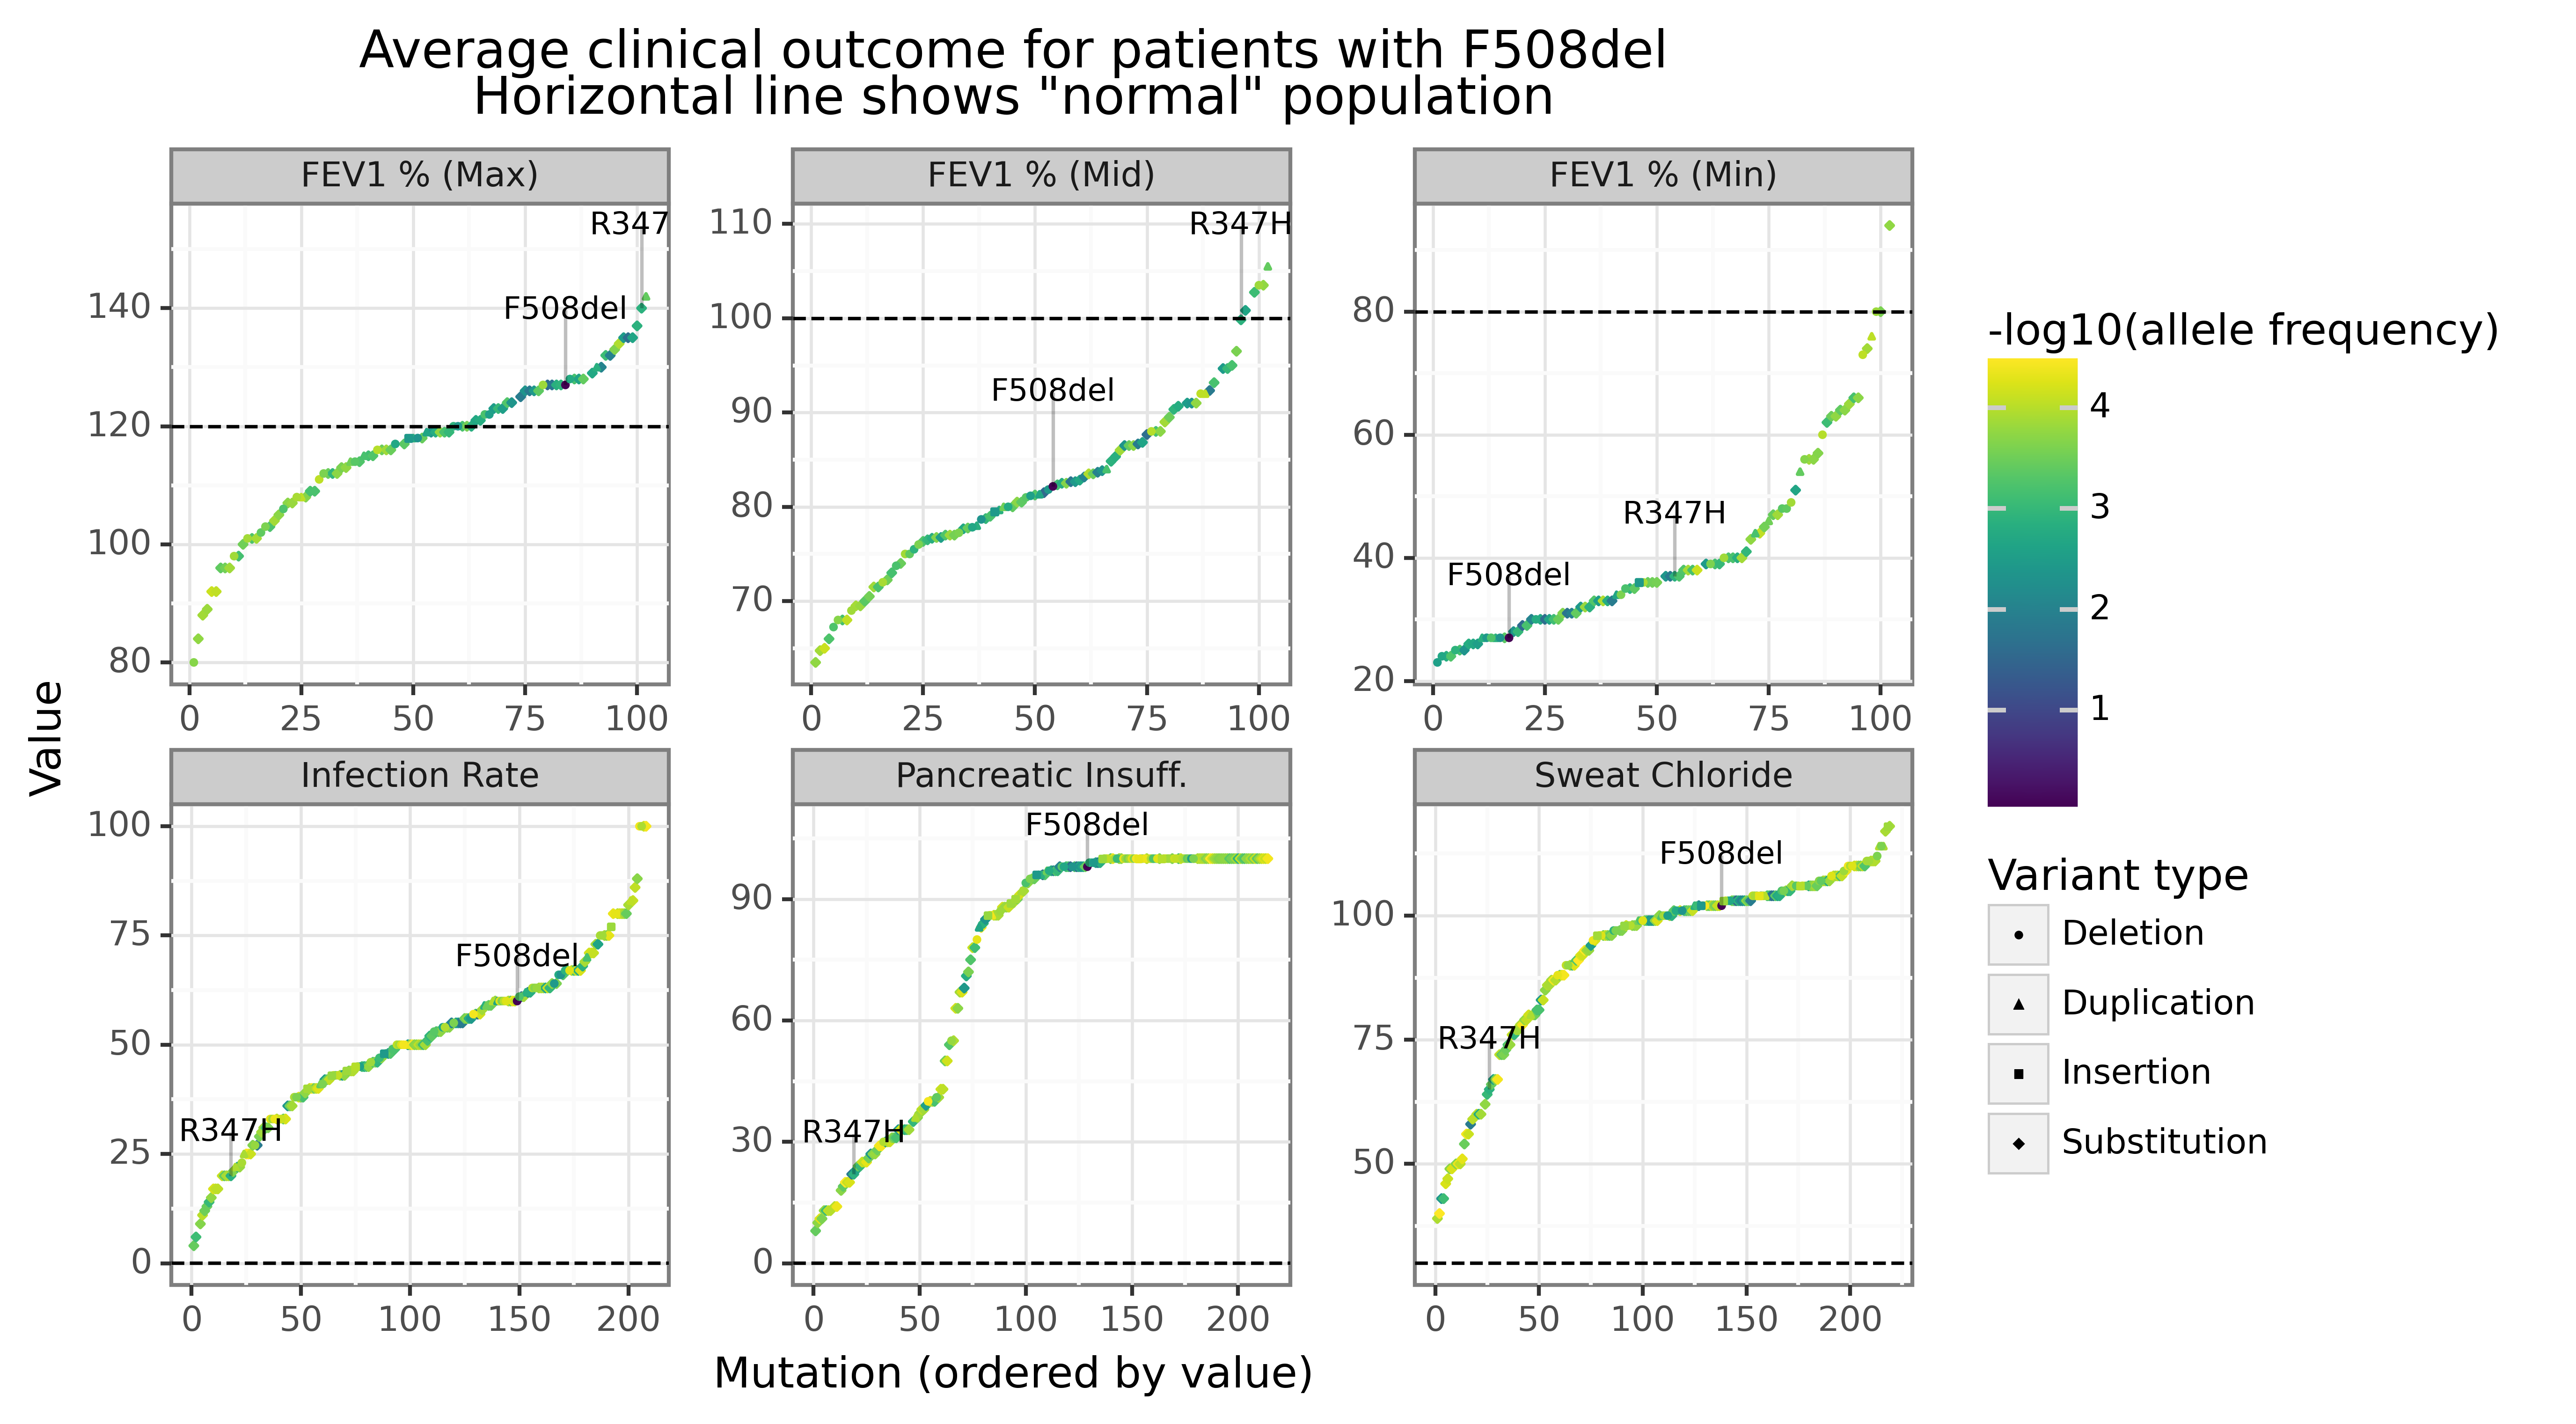
There is a tremendous amount of variation across genotypes in the clinical outcomes we observe for different mutations. The figure below shows the empirical CDF for different values of the F508del heterozygous mutations (except for F508del itself which is homozygous). Each dot in each figure corresponds to a different genotype (pair of mutations) which have been ordered along the x-axis. The text highlights the (relatively) mild R347H-F508del genotype to the more severe F508del-F508del genotype. The extent of this variation suggests that the structural factors of CFTR mutations could play some role in rank ordering this outcomes.
(4) Processing pipeline
The diagram below provides an overview of the scripts that are used to prepare the data for model training and their associated output. This section will provide an overview of the data processing pipeline.
Overview of data processing pipeline
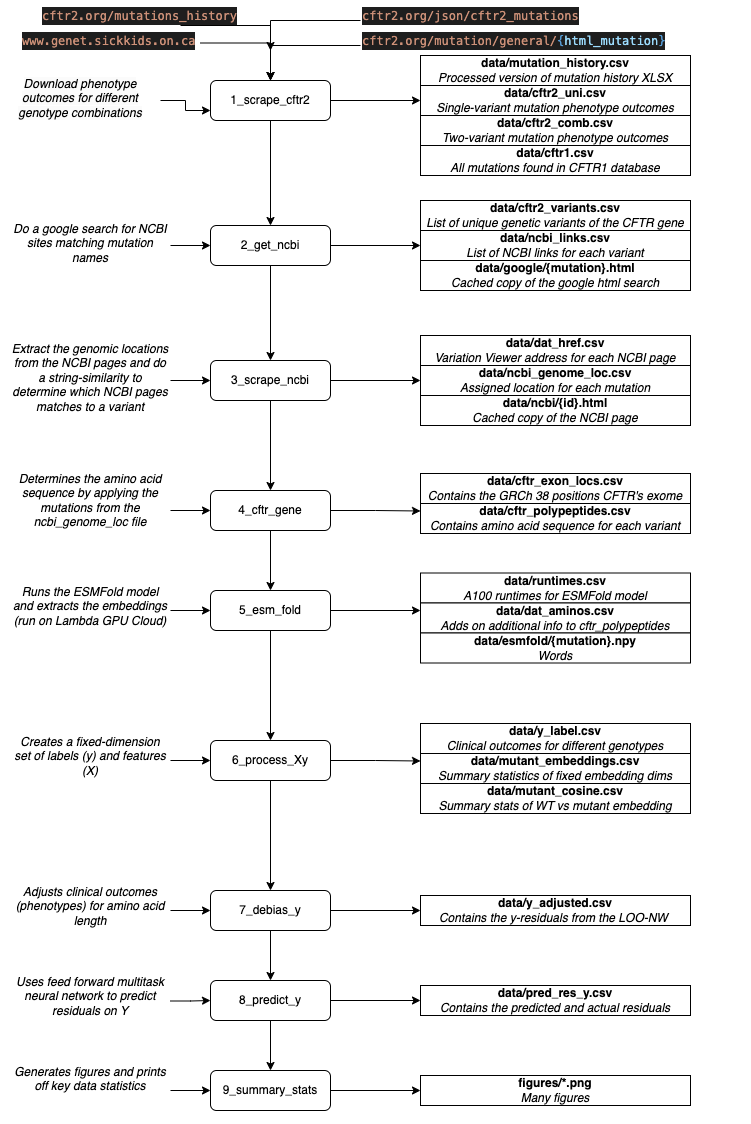
The first script, 1_scrape_cftr2, loops over the list of mutations from the CFTR2 website (see cftr2_mutation.json).[4] A total of 417 single-variant mutation data was scraped. Note that if data is missing for a single-variant, it will always be missing for a two-variant combinations since the population size can only shrink. The CFTR2 imposes a small-cell limit of 5, so that no observation with 5 or fewer patients has an observation, whereas all non-missing observations have at least 6 patients.
A total of $296 \choose 2$=43660 plus 296 homozygous pairs could possibly have data. Instead of running all of these combinations, I multiplied the allele frequency of in the individual variants together, and sorted the estimated allele frequency of the two-variant pairs to the top 25000 pairs. Past the first thousand or so ranked pairs, the odds of finding one that has a CFTR2 page, let alone non-missing data becomes increasingly rare. A total of 1885 mutation pairs were obtained from CFTR2 (of which 294 are F508 heterozygous and 169 are homozygous).
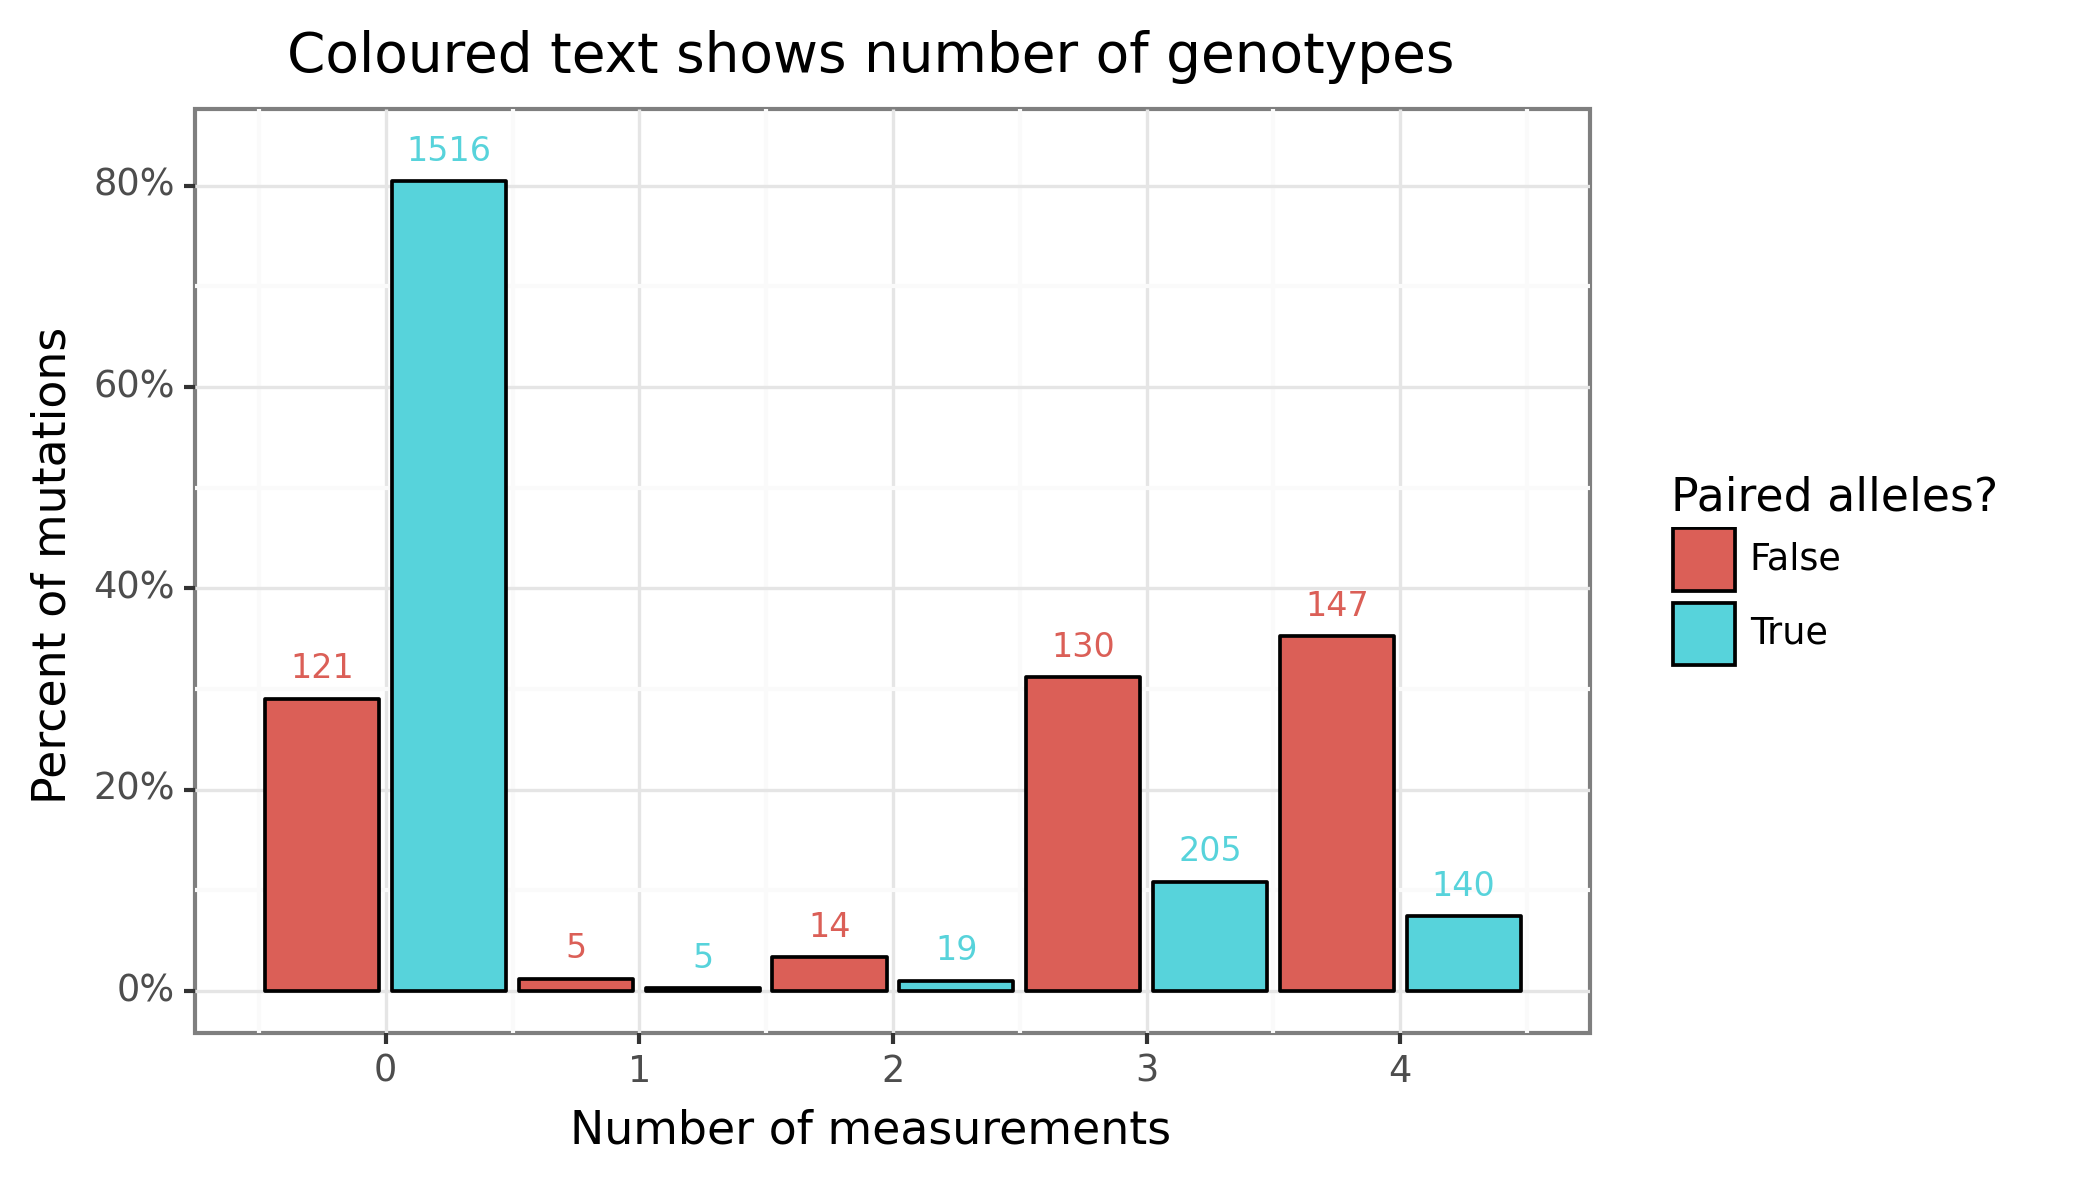
Figure 1 provides a visual breakdown of these numbers, where “number of measurements” is the number of non-missing measurements for one of the four phenotypes, and “paired alleles” refers to whether it is the single or two-variant combination. As we can see, the number of single-variant genotypes with at least one value (296) represents most of the data (~70%), with most of these having three or four measurements (out of four). In contrast for the two-variant combination, only 369 of the 1885 mutations (~20%) have at least measurement. Of these 369 non-completely missing two-variant pairs F508del accounts for 219 of them (~60%), and there were a total of 294 two-variant F508del pairs (~75%). In summary, the two-variant pair is very much an F508del affair.
Figure 1: Number of mutations with data
The second script, 2_get_ncbi, search google for each of the 417 variants, and extracts any possible NCBI links (there can be more than one). The 3_scrape_ncbi script then loads the cached copy of the NCBI pages, and extracts the address of the GRCh38 NCBI Variation Viewer.[5] A simple parse of this address then determines the genomic location.
Because there can be multiple NCBI pages matched to each mutation, the following process is used to determine the final match.
- We compare the name found on the NCBI page (
names) to the original mutation name (val)(an example table shows this for cDNA name for mutation 1119delA). The closest string match (measured in Levenshtein distance) for eachname_typeis then selected. - Any match that has a Levenshtein distance of 10 or greater is removed.
- If the cDNA and protein name align (in terms of genomic coordinates), then this value is chosen.
- For the mutations that disagree, we prioritize the cDNA match.
| mutation | id | from | to | names | name_type | val | lev |
|---|---|---|---|---|---|---|---|
| 1119delA | 54097 | 117540215 | 117540215 | c.987del | cDNA | c.987delA | 1 |
| 1119delA | RCV000007567 | 117531050 | 117531050 | c.429del | cDNA | c.987delA | 4 |
The fourth script, 4_cftr_gene, converts the mutations into an altered CFTR gene and amino acid sequence. The reference DNA sequence is based on GRCh38 and Ensembl 109. The CFTR gene is made up 27 exons and 4443 base pairs. The CFTR1 page has a convenient visual browser for this gene. Interestingly the CFTR1 posted DNA sequence differs to the Ensembl-based version by a single-base pair, however a quick sanity check reveals that this position matches Ensembl’s version.
Figure 2 below shows the position of 341 exonic mutations on the CFTR gene. The vertical axis shows that negative log allele frequency, highlighting that F508del (70%) is 28 times for prevalent than the next most frequent mutation G542X (2.5%). Most mutations are point substitutions (70%), followed by deletions (20%), duplications (8%), and insertions (2%). The pathogenic CF mutations are found across the exonic region of the CFTR gene.
Figure 2: CFTR exonic mutations
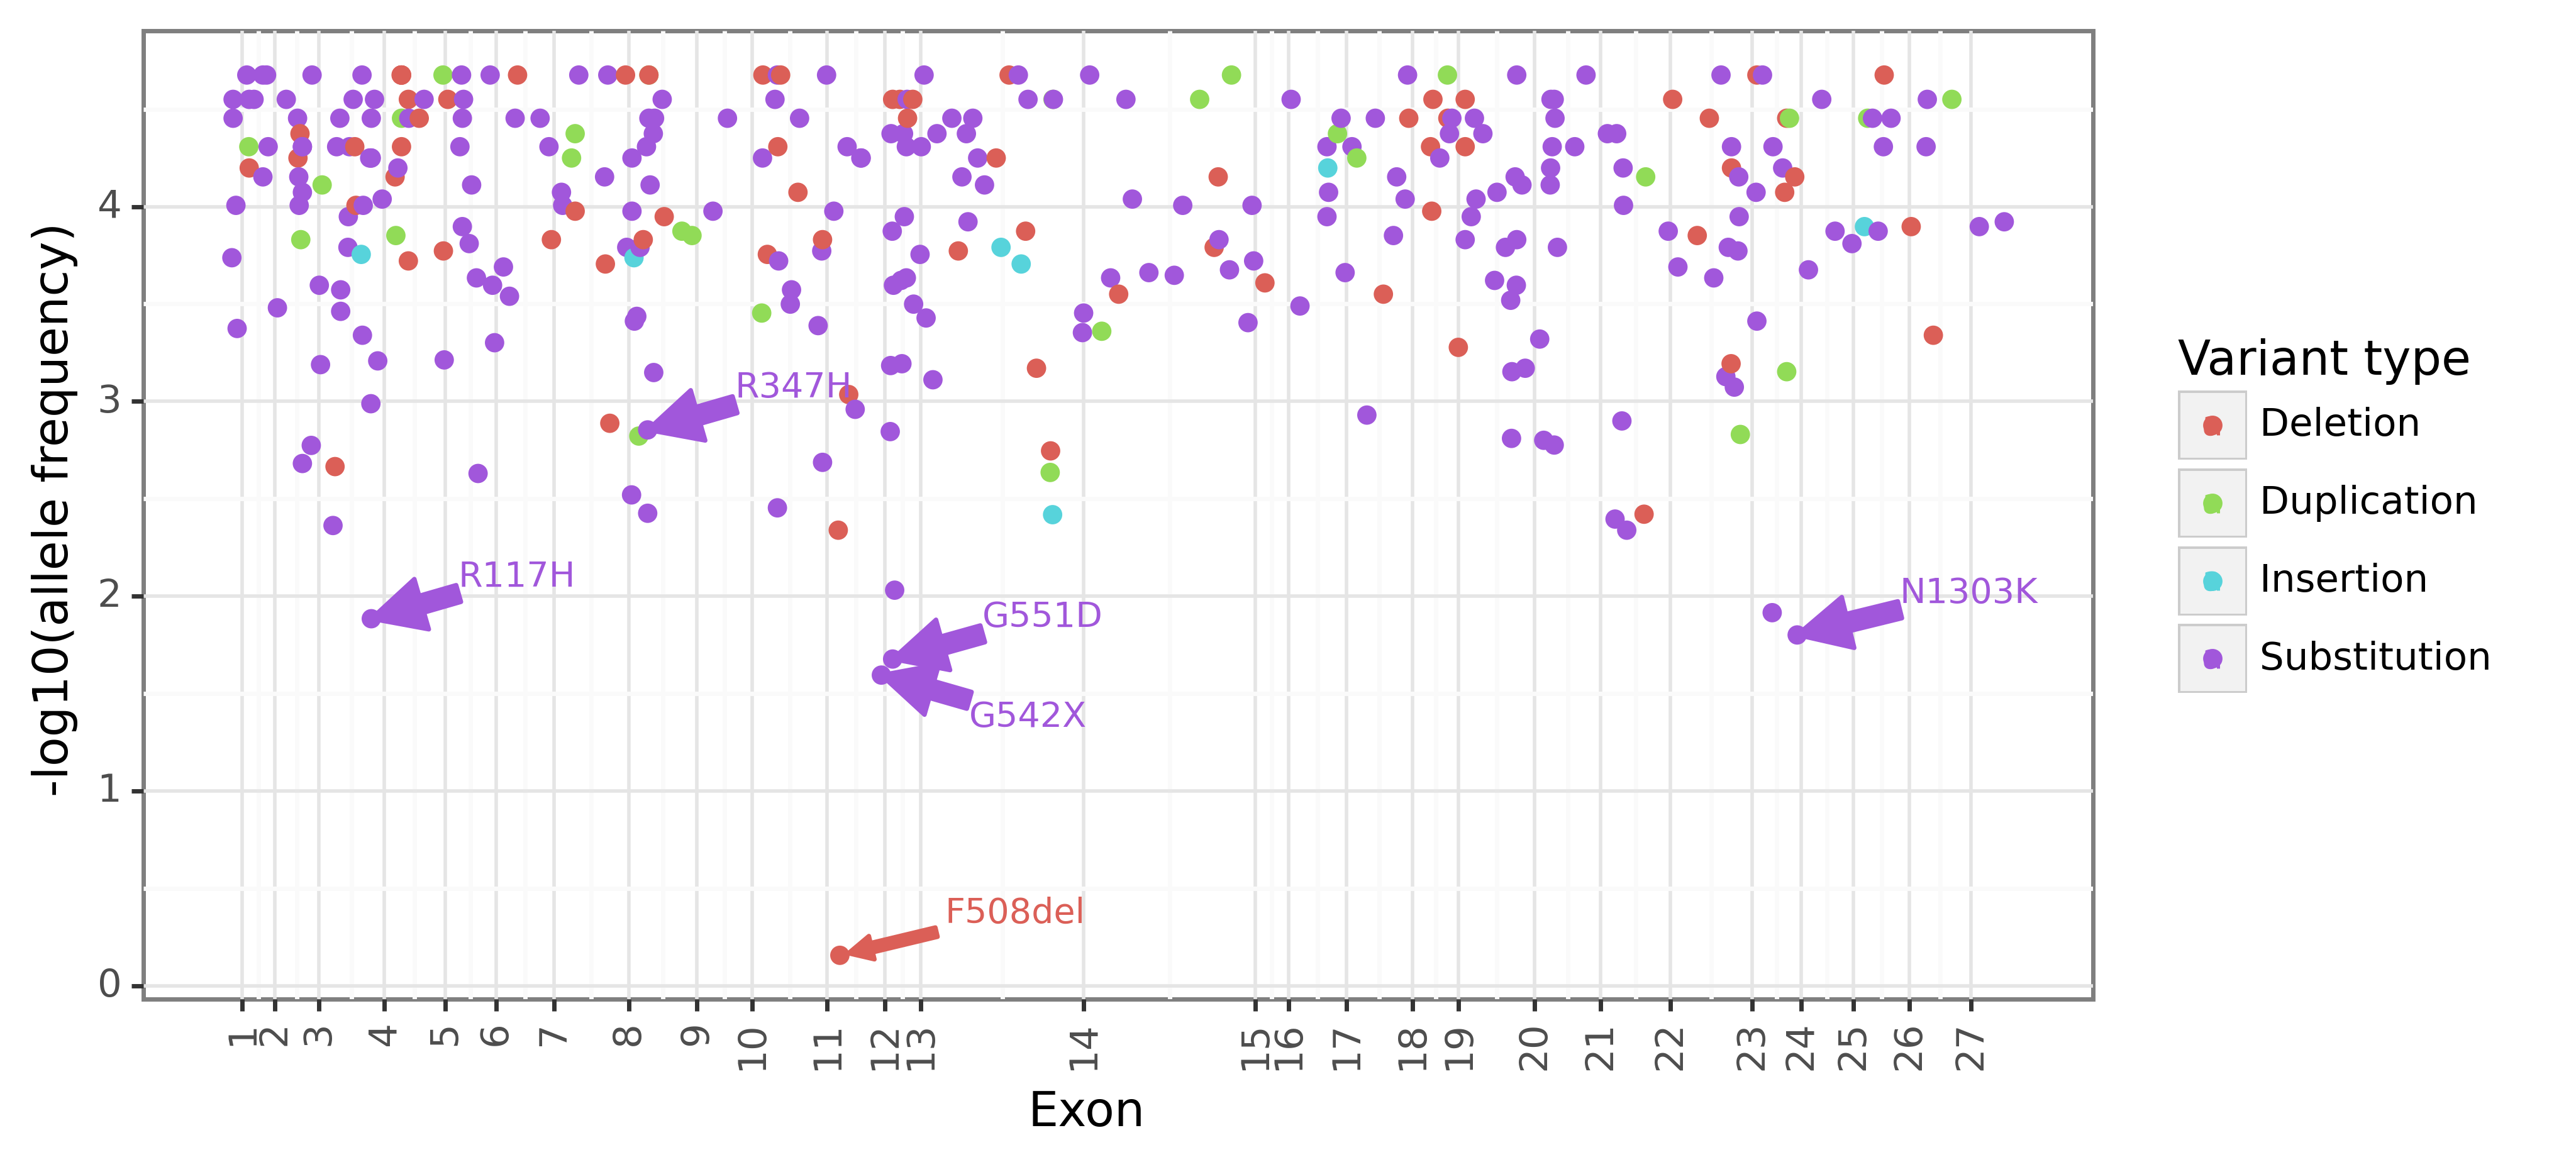
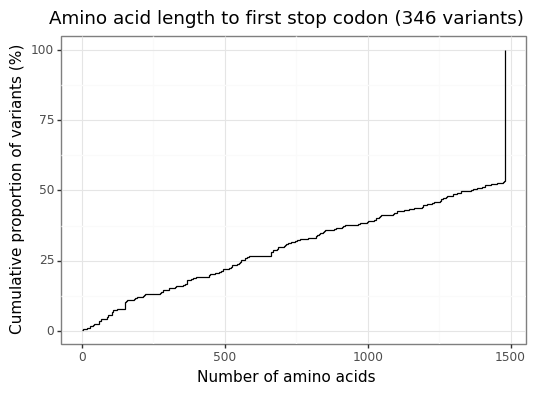
Figure 3 shows the empirical CDF of the amino acid length for each version of mutated CFTR gene. The wildtype CFTR gene has 1480 amino acids,[6] and around half of the exonic CFTR mutations are (approximately) this length.[7] Mutant CFTR genes can have significantly fewer amino acids than the wildtype due to mutations which add a stop codon. Such effects can have devastating consequences for gene function.
Figure 3: Mutant CFTR gene lengths to first stop codon
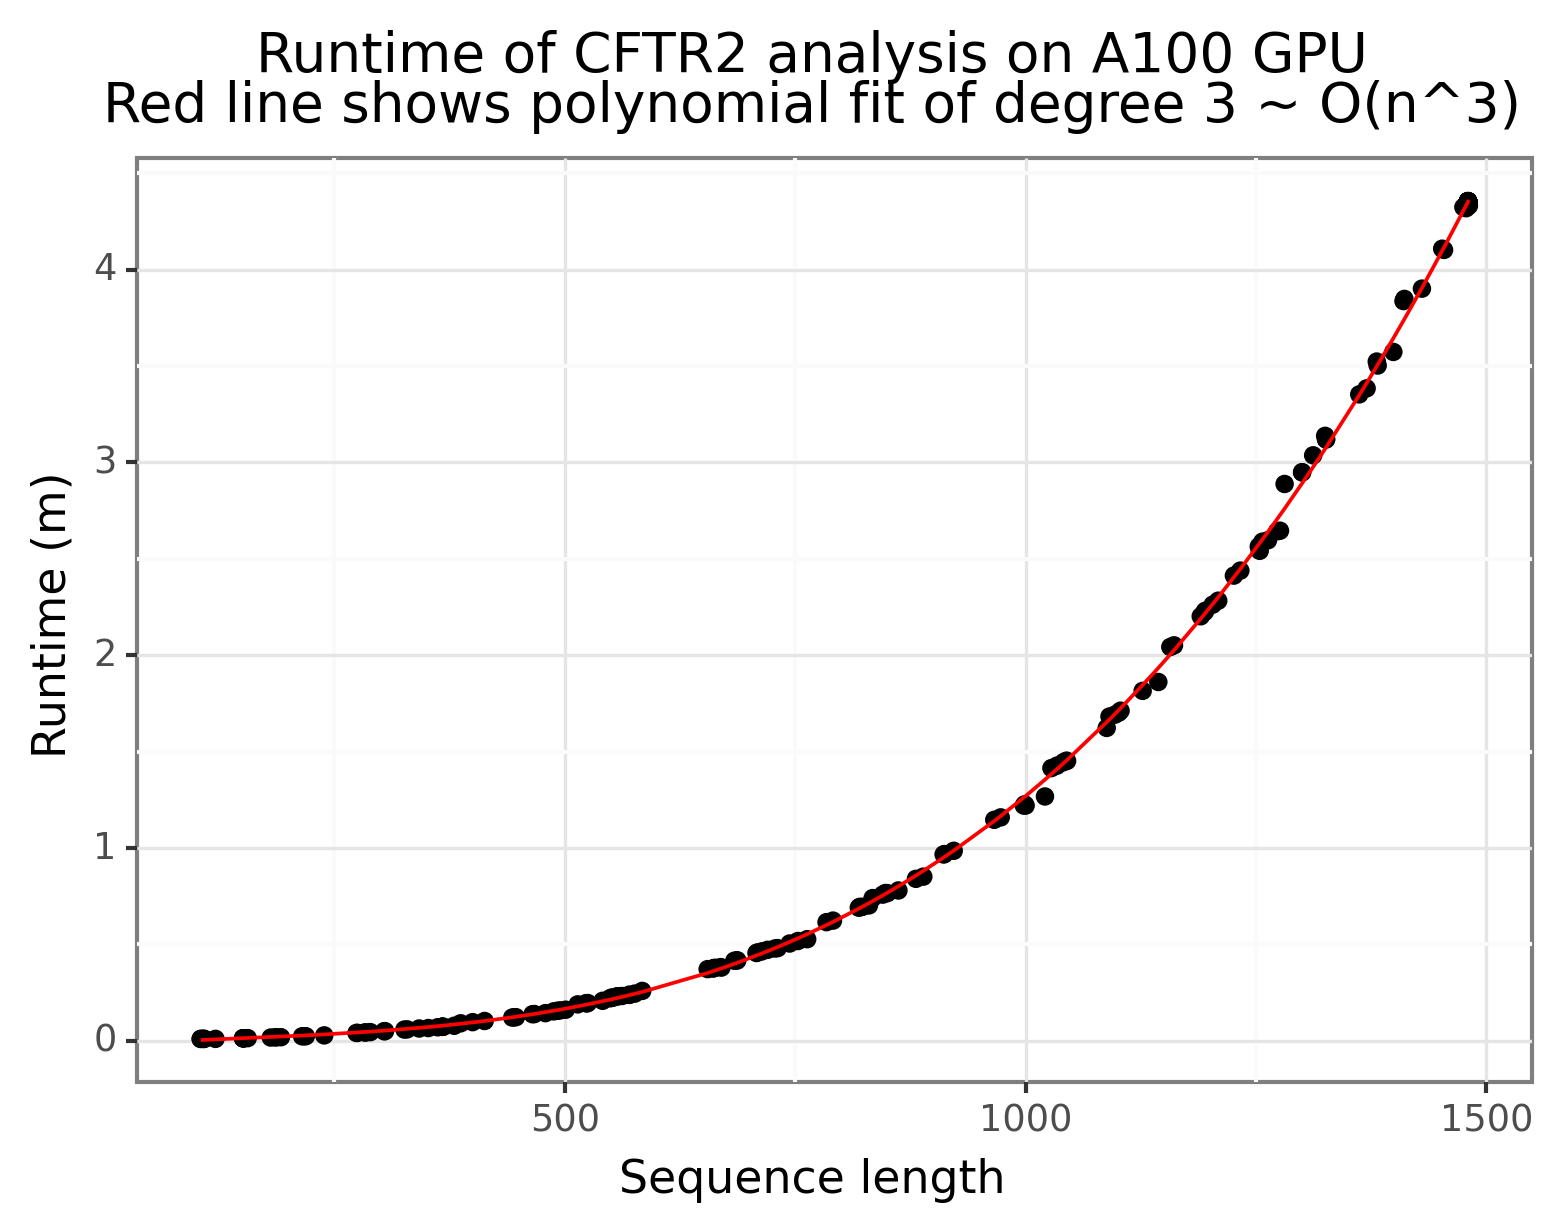
With the mutated amino acid sequences ready, script 5_esm_fold can be run to extract the embeddings from the ESMFold model. I used an A100 on Lambda Lab’s GPU Cloud (see lambda_cloud_setup.sh for details on setup). A total of 311 amino acid sequences were passed through the model, and the runtime under current configurations is about 24 hours (this includes the downloading time). Figure 4 below shows that it takes ~4 minutes for a single forward pass (num_recycles=1) for an amino acid sequence length of 1500 with ESMFold, with a runtime complexity that grows cubically. The following types of mutations were not passed through the model:
- Mutations with duplicated sequences (since their embeddings could be copied from a different inference run).
- Synonymous mutations (since they have the same polypeptide sequence as the wildtype).
- Mutations who amino acid length is than 100 (caused by a stop codon being inserted too early in the gene).
For example, there were two synonymous mutations that were stripped out of the inference stage: 3120G->A and 3600G->A (see here and here).
From the forward pass, the following embeddings were extracted:
s_s-(1, n_amino, 1024): Per-residue embeddings derived by concatenating the hidden states of each layer of the ESM-2 LM stem.s_z-(1, n_amino, n_amino, 128): Pairwise residue embeddings.states-(8,1,n_amino,384): Hidden states from the protein folding trunk.
Figure 4: ESMFold has a polynomial runtime
(5) Features and labels
To actually train a ML model we need a set of labels and features. As Section 4 outlined, by the end of the processing pipeline, for each mutation there are (up to) four clinical outcomes/phenotype measurements along with embeddings of varying dimensionality (n_amino) from the ESMFold model. This section will describe what gets done in the 6_process_Xy script to create a set of tabular features and labels.
ESMFold embeddings
In order to use off-the-shelf ML algorithms (e.g. XGBoost, NNets, etc) we need the feature space to be a fixed dimension.[8] Two approaches were used to generate fixed dimensions.
- The average, min, max, and standard deviation of all dimensions from each embedding are taken except the last.
- The average, min, max, and standard deviation of the cosine similarities between the wildtype and mutant CFTR embeddings are calculated.
The first approach simply calculates the mean over all dimensions except the last. For example, s_s is a (1, n_amino, 1024) matrix, so we simply take the mean over dimensions 1 & 2 and get back a vector of length 1024. This is repeated for the min, max, and standard deviation. The final dimensionality is equivalent to 4(384 (states) + 1024 (s_s) + 128 (s_z))=6144.
The second approach is a bit more involved. Before calculating the cosine similarity, the matrices are reduced to two dimensions. For s_s this is easy, and the first dimension is simply flattened ((1, n_amino, 1024) becomes (n_amino, 1024)). For states, the average is taken ((8,1,n_amino,384) becomes (n_amino,384)). For s_z the diagonal is taken ((1, n_amino, n_amino, 128) becomes (n_amino, 128)). Next, we calculate the cosine similarity between the wildtype and the mutant for each, and get back three matrices of dimension: (1480,n_amino), where the i,j’th entry corresponds to the cosine similarity of wildtype dimension i and mutant dimension j for the respective embeddings. Like the first approach, the mean, min, max, and standard deviation are calculated across the rows giving a total of $4\cdot 3 \cdot 1480=17760$ features.
These features can be concatenated to obtain a final feature vector of length 23,904 for each mutation.
Clinical outcomes (phenotype)
While there is one set of feature measurements for each genotype (mutation), there are numerous ways we could quantify the phenotype (clinical outcome). For example mutation R560T has five different CFTR2 pages with at least one clinical measurement: i) R560T, ii) R560T-F508del, iii) R560T-R560T, iv) R560T-G551D, and v) R560T-N1303K. Therefore, when we speak of R560T sweat chloride measurement, which one are referring to? While the genotype features are clear, what are the phenotype measures?
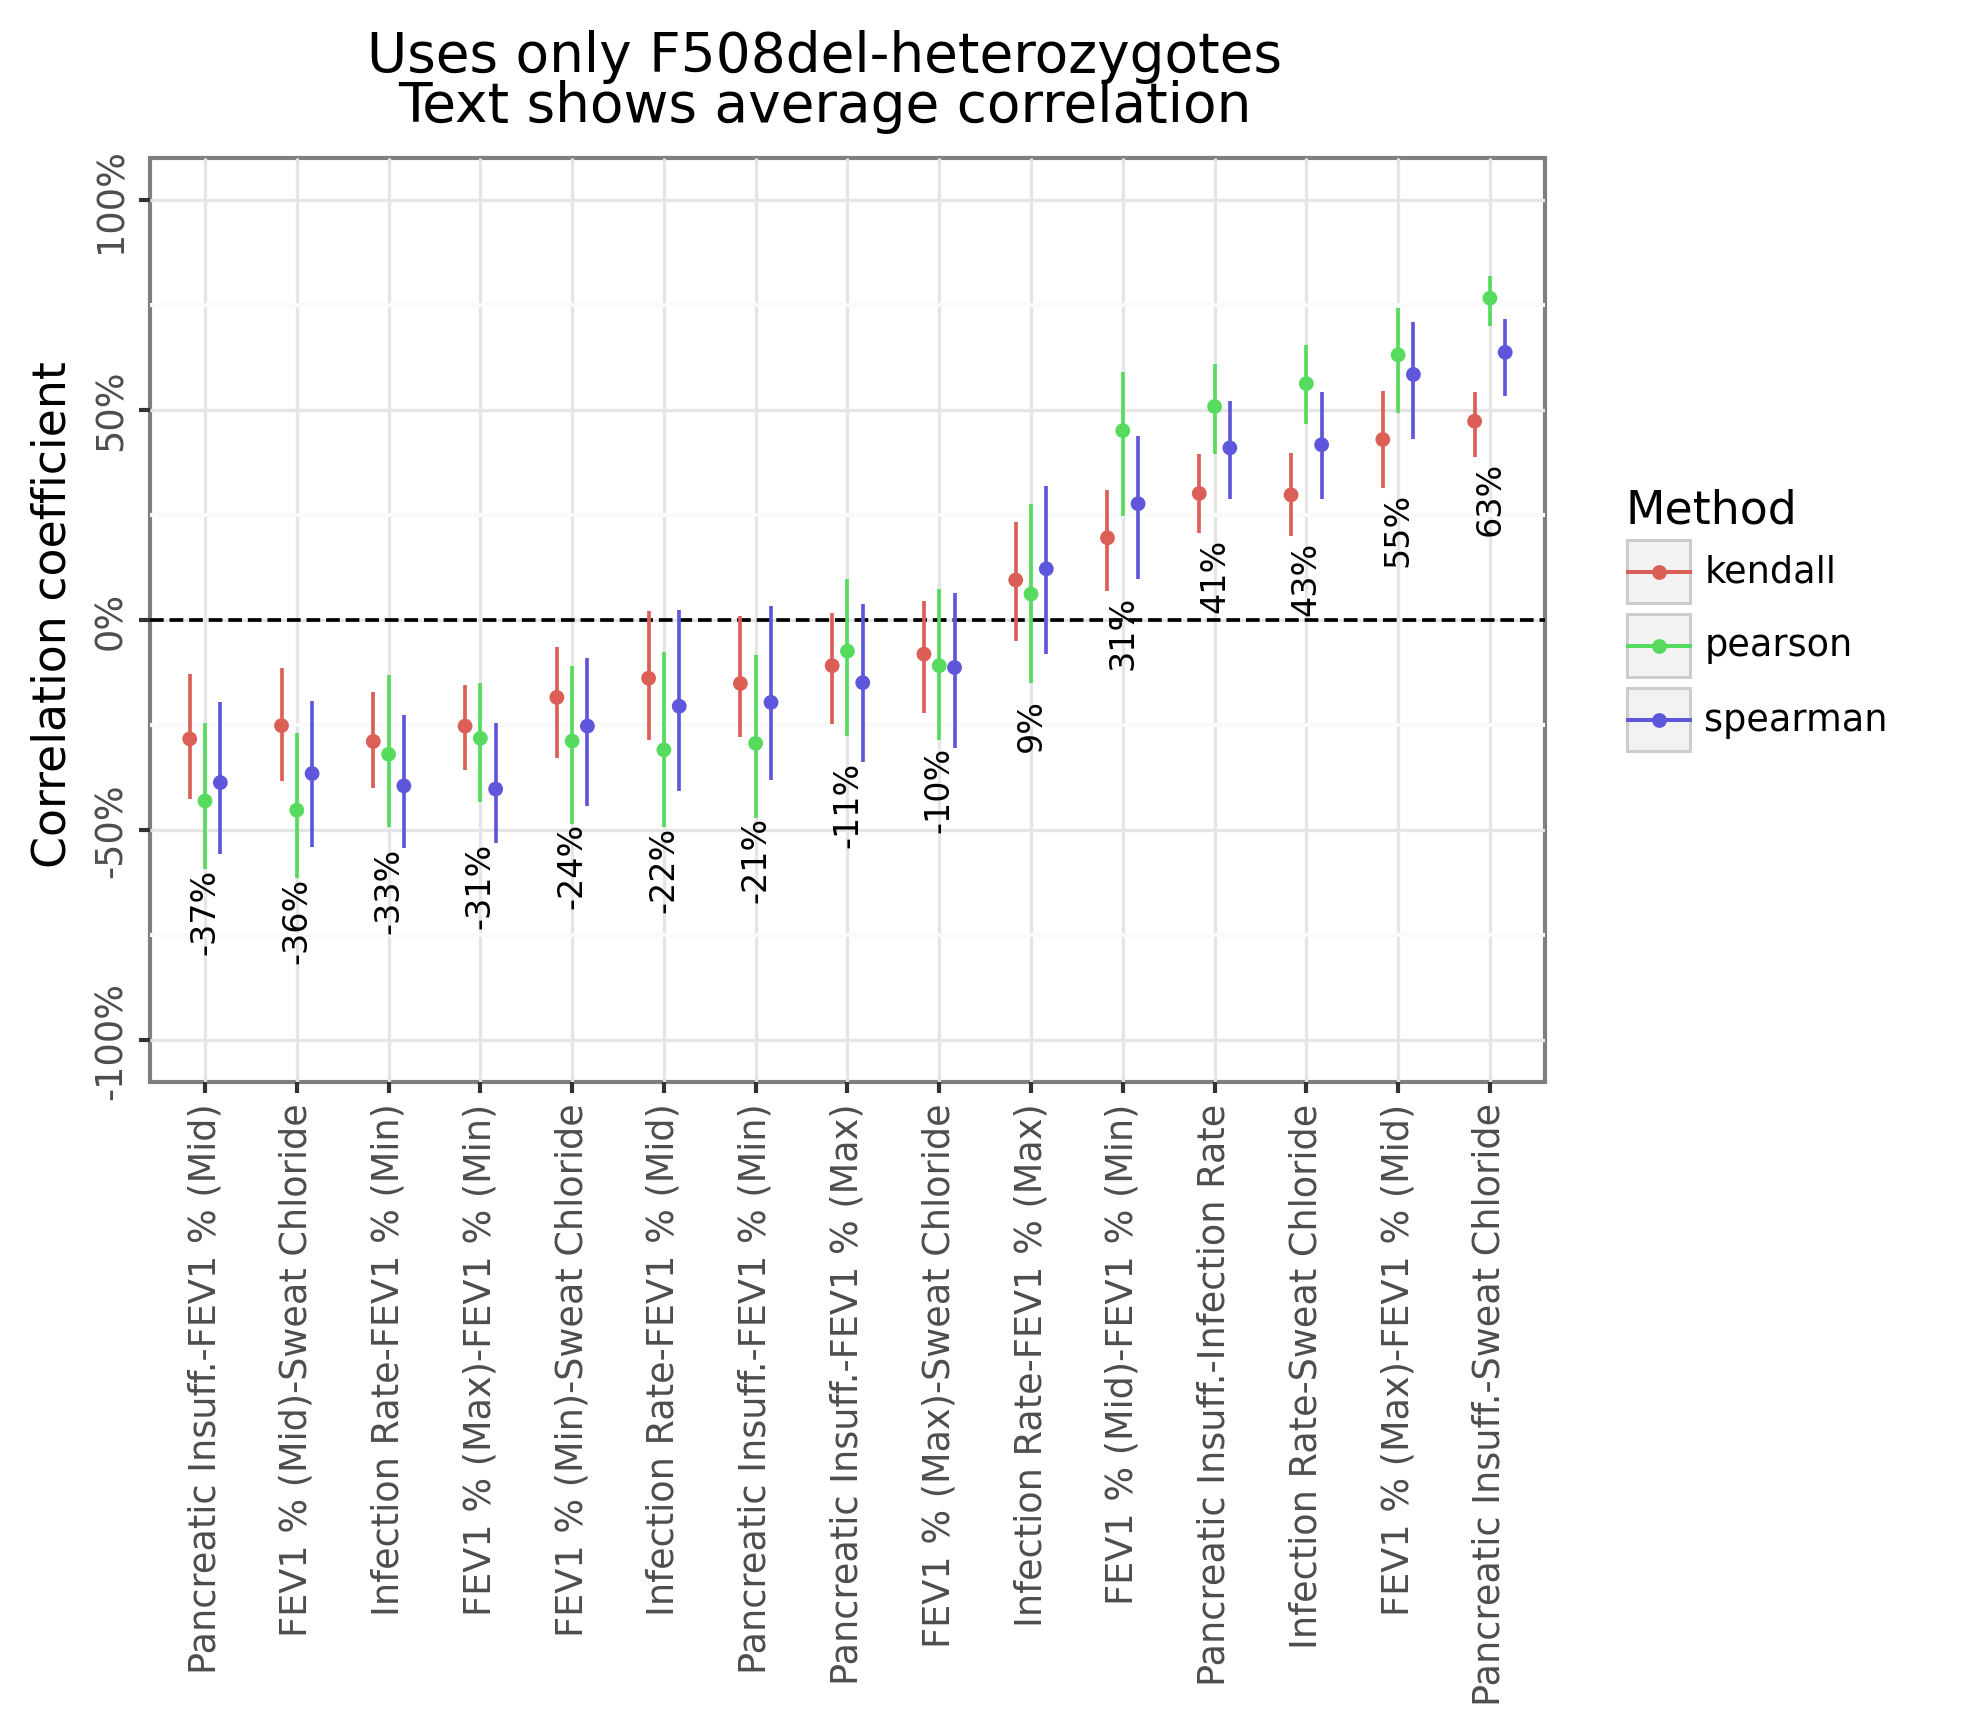
Figure 5 below shows that many of the phenotype categories tend to be correlated to each other (-37% to +63%). For example, mutations which tend to have higher pancreatic insufficiency will also have higher sweat chloride levels but lower lung function.
Figure 5: Between category correlation
The rest of this section describes how the preliminary number of phenotype categories were determined (15) along with the four different approaches to calculating each category. This led to a total of 60 different possible labels (although most of these were not used during model training).
Lung function
The CFTR2 database provides a min-max range of lung function for three different age range (<10, 10-20, 20+). I calculated the min, max, and midpoint for each of these age ranges, along with an “All-ages” category (see process_lung_range in utilities.utils).[9] Thus there are a total of 12 lung measurements, (the combination of four age categories and three statistics). When combined with the three other clinical measures (sweat chloride, pancreatic insufficiency, and pseudomonas infection rate) there a total of 15 categories of phenotype.
Label types
Four label types were used calculate for each mutation:
- A single-mutation average which includes all patients who had one or more of the alleles (e.g. R560T)
- The heterozygous combination with F508del (e.g. R560T-F508del)
- The homozygous combination (e.g. R560T-R560T)
- The average of all heterozygous combinations (e.g. the average of R560T-F508del, R560T-G551D, R560T-N1303K)
Figure 6 below shows the within-category correlation across the four label types, which ranges from an average of 66% to 95%. The heterozygous average (approach #4) has the highest correlation with F508del-heterozygous (approach #2) for the simple reason that of the 219 mutations that have at least one heterozygous measurement for at least one phenotype, 176 only have F508del (80%). In contrast, the homozygous measurements (approach #3) have the lowest correlation, although this depends on the category (see Figure 7). The relationship between the allele-specific average (approach #1) and the heterozygotes (approach #2 & #4) is strong on average (see Figure 8), although there meaningful differences for many mutations.
Figure 6: Within category correlation
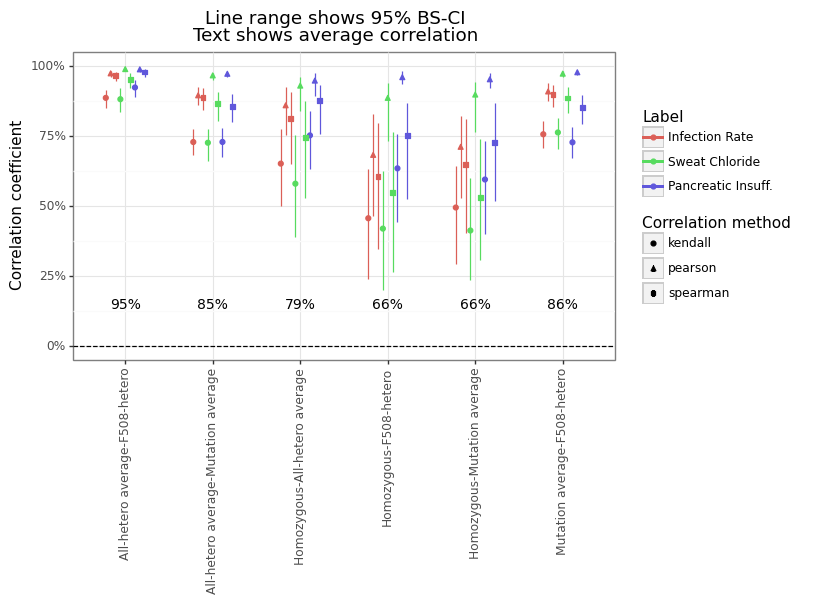
Figure 7: Relationship between homozygous and F508del-heterozygous
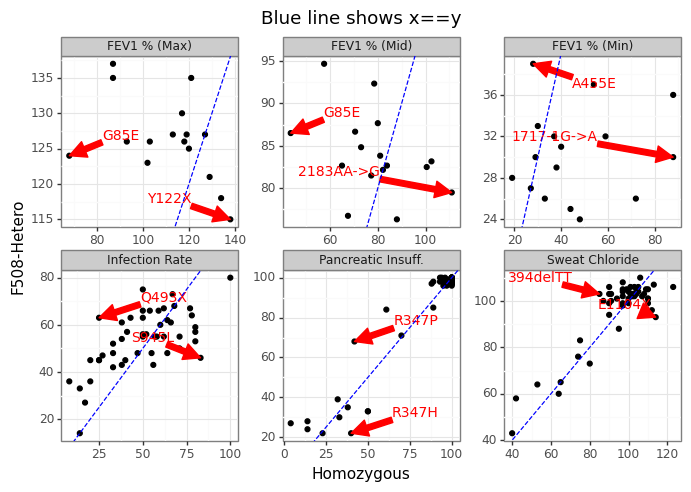
Figure 8: Relationship between allele average and heterozygotes
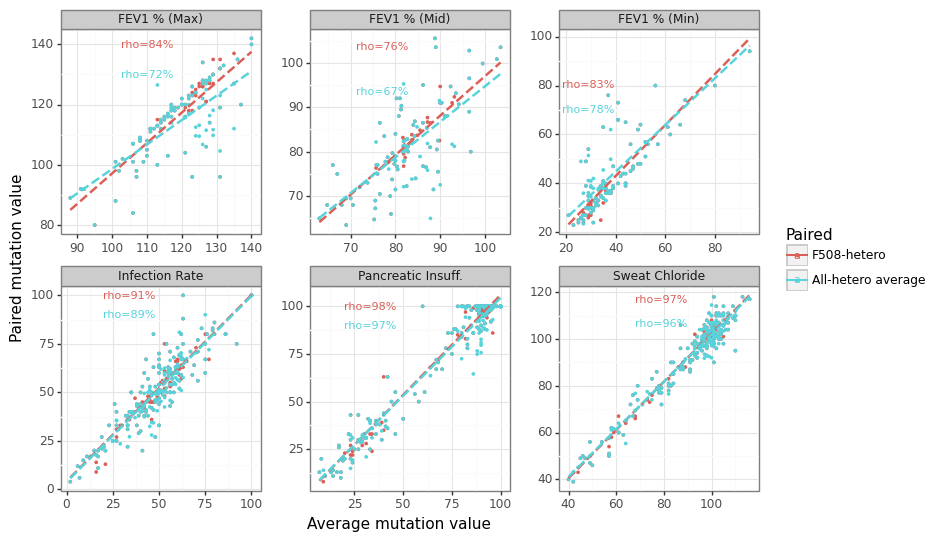
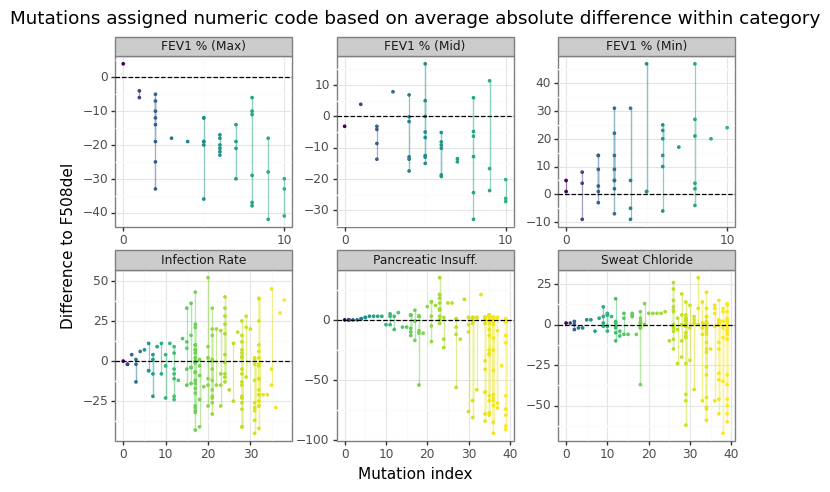
Figure 9 shows why coming up with “one” phenotype for a mutation is challenging since different heterozygotic pairs can have tremendous variation in clinical outcomes. In other words, how bad a mutation is really going to depend on which other mutation it is paired with.
Figure 9: Range of heterozygous outcomes to F508del
Adjusting for confounding
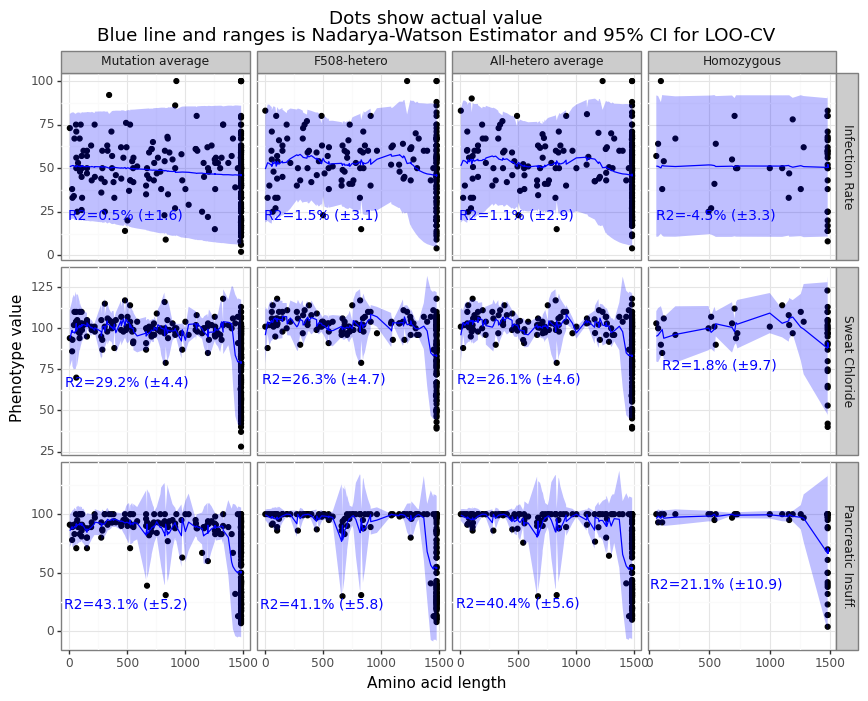
One thing that became clear after some exploratory analysis was that the ML models were basing their predictions based on a confounding relationship: mutations whose CFTR gene was about the same length as the wildtype (~1480) had better clinical outcomes than those mutations with stop codons inserted early, particularly for sweat chloride and pancreatic insufficiency. Up to 43% of the clinical variation can be explained by simply knowing the length of the polypeptide chain to the first stop codon (see Figure 10). The 7_debias_y script uses a leave-one-out Nadarya-Watson kernel regression method to get the “length-adjusted” clinical phenotype value. This both ensures that any predictive model will not be confounded by amino acid length, but also provides an estimate of how much additional correlation comes from the embeddings. For any prediction where the R-squared was less than zero, the label intercept was used instead of the NW estimator (in practice, this meant the homozygous infection rate).
Figure 10: N-W kernel regression adjusts clinical outcomes
(6) Results
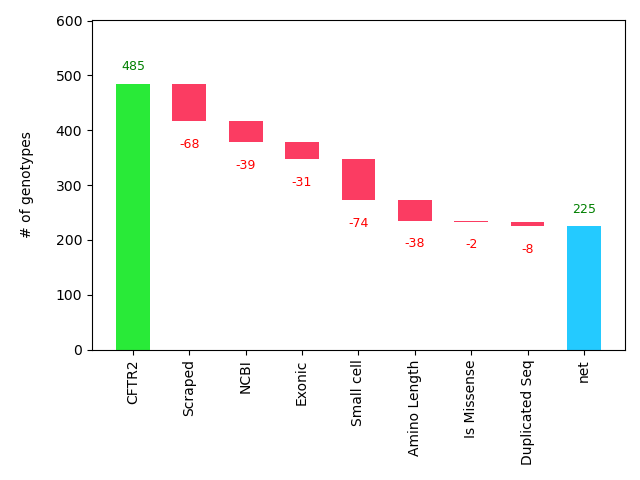
A total of 225 samples were available for training and evaluation. This means 260 CFTR mutants were removed during the processing pipeline, for which Figure 11 provides a breakdown.[10] Of these 260, 105 were due to external factors (mutations not occurring on the exonic regions (31) or lacking data in CFTR2 due to small-cell censoring (74)), 107 were due to data collection issues (not all URLs were parsed (68) and not all mutants could find an NCBI page (39)), and 48 were due to processing choices (short protein sequences were removed (38), along with missense (2) and duplicate (8) mutants). Of these data losses, only the exonic regions is structural, suggesting future work could help to double the sample size by adding another 229 mutations.
Figure 11: Factors determining final dataset size
Set up
Early exploratory work revealed that predictive models for the lung function categories (for all label types) showed performance largely no better than random guessing (see this figure). The final model run used only 12 labels from the combination of three categories (sweat chloride, pancreatic insufficiency, and infection rate). A simple two-layer neural network model was used to predict all 12 outcomes simultaneously. The NNet used a learning rate of 0.0001, an Adam optimizer, hidden layers of size 124 and 24, a ReLU activation function, and was trained for 700 epochs. The number of epochs was based on exploratory work for a single random of fold of data, limited the risk of information leakage. The model had a total of 2,967,520 parameters.
Since many of the category/label combinations were missing, I opted to impute the missing labels before training to avoid having to apply masks. During inference time this was not an issue since only the actual values could be compared to the predictions. For every training fold, the missing outcome values were imputed in an iterative manner using a ridge regression model.
Given the small sample size, a dedicated testing set was not possible, so instead performance is measured “out-of-fold”. A total of 5 folds were used during cross-validation.
Performance
The overall rank correlation between the predicted and actual length-adjusted outcomes ranged from 1-31%. Figure 12A and Figure 12B show the level of performance for three different measures: Spearman’s rho, Kendall’s tau, and Somers’ D. Spearman’s correlation is the degree of linear correlation between the ranks of the outcome and the predicted levels. In contrast, Kendall’s tau and Somer’s D capture the degree of pairwise concordance, the only difference being how they handle ties. The average rank correlation across categories and labels was highest for Spearman’s rho (20%), and conservative for Somer’s d (14%) and Kendall’s tau (14%).
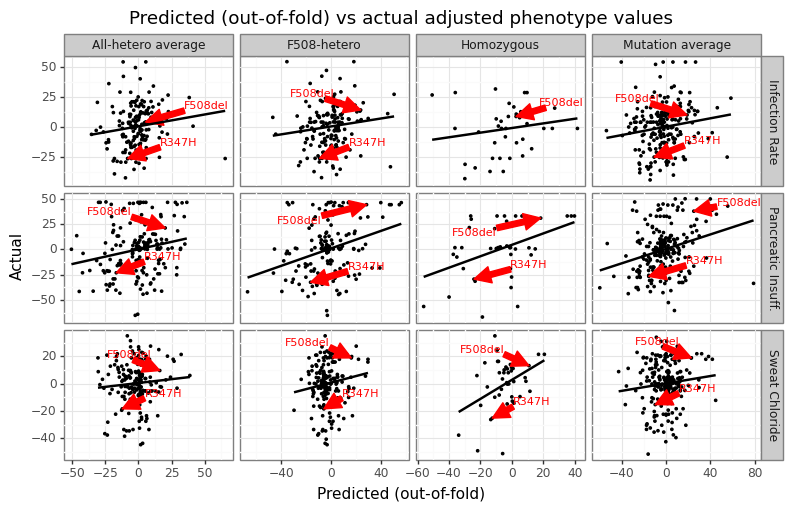
The predicted to actual phenotype value can be seen in Figure 13 for all label types. Some labels tend to have more missing data (homozygous), while sweat chloride category has the most samples overall. The figure highlights the relative position of the predicted phenotypes for F508del and R347H. As noted before, the former is a more severe mutation compared to the latter, and the predicted values reflect this difference.
Figure 12A: Predictive correlation for ESMFold-NNet model
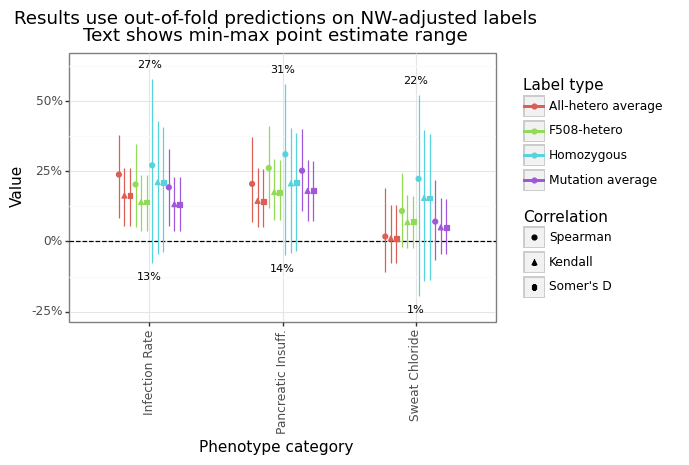
Figure 12B: Predictive correlation for ESMFold-NNet model
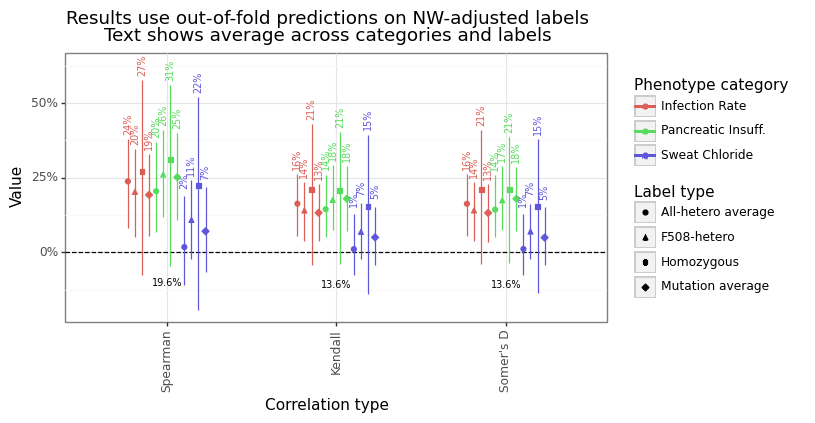
Figure 13: Predicted vs actual (adjusted outcome) for ESMFold-NNet model
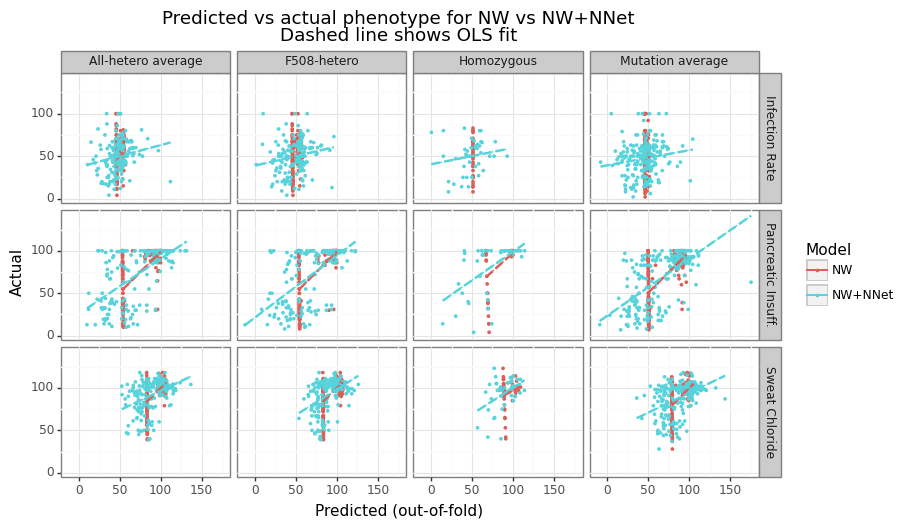
Recall that this predicted performance is on the residuals of the Nadarya-Watson (kernel regression) model, rather than the phenotype itself. We want to check whether there is an increase in performance when the ESMFold-NNet model’s output is added onto the NW estimator and if so, its magnitude. Figure 14 shows NNet’s output is able to increase performance for most categories and label types. The improvement is the modest for the Infection Rate category (-1 to 13%), moderate for the Sweat Chloride (8 to 27%) and strongest for predicting Pancreatic Insufficiency (29 to 36%). Figure 15 shows the predicted vs actual outcome for both the NW and NW+NNet model. The NW predictions tend to be flat for most of the predicted range except for the CFTR mutations close to the wildtype length.
Figure 14: Improvement in correlation from ESMFold-NNet model
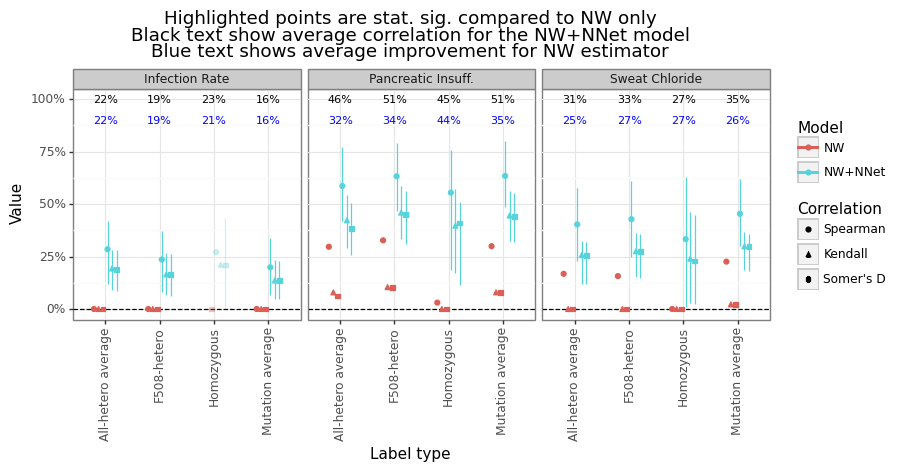
Figure 15: Predicted vs actual for ESMFold-NNet model
(7) Summary
This analysis has shown how predictive model can be built to predict the severity of CF outcomes using the embeddings from ESMFold. The model is able to demonstrate non-trivial and statistically significant performance for a variety of rank order measures for three phenotype categories (sweat chloride levels, infection rates, and pancreatic insufficiency) for multiple approaches. There does not appear to be any signal for predicting lung function. Overall, linking clinical outcomes of the CFTR2 database to representations of core biological structures suggests a new tool for classifying the pathogenicity of CFTR mutations.
This research was carried out on an independent basis as a side project, and many possibilities exist for future research. Five key areas for improvement are mentioned below.
- Improvements to the processing pipeline to obtain more samples
- Use of non-censored clinical values from the CFTR2 database
- Multiple forward passes through ESMFold (i.e. increasing the number of recycles)
- Experimenting with different regression model architectures
- Weighting labels by sample size during training and evaluation
-
It is also possible for synonymous mutations (i.e. ones that don’t change the amino acid) to cause disease as well, as they can affect protein expression, folding, and stability. For example, synonymous mutations can affect mRNA splicing leading to abnormal proteins. ↩
-
The FDA considers a rare disease to be one which affects less than 200K people in the United States, and there are around 40K people with CF in the US. For example Trikafta is classified as an “orphan drug” because it treats a rare disease and thus gets extra incentives such as extended patent protection. ↩
-
CF might be the fifth most common rare disease. ↩
-
Unfortunately I later realized that of the 485 mutations found on this JSON list, I had only scraped 417 of them, meaning that 68 were not included in the analysis (of which 41 where CF-causing, 24 were non-CF-causing, 2 had unknown significance, and 1 had varying clinical significance, according to CFTR2_29April2022.xlsx). This issue stemmed from how special characters get encoded in the HTML address, and is something that can be fixed in any follow up analysis. ↩
-
For example
variation/view/?chr=7&from=117611638&to=117611638&mk=117611638:117611638%7CNC_000007.14&assm=GCF_000001405.26,1becomes is position 117611638-117611638 on chromosome 7. ↩ -
As mentioned before, there are 4443 base pairs, the first 4440 corresponding to the amino acids that fold the polypeptide chain of the protein, and the last three base pairs corresponding to a “stop” codon. ↩
-
I say approximately because some mutant CFTR genes have 1481 amino acids (see L138ins), and of course F508del is missing exactly one codon meaning it has a length of 1479. ↩
-
This is not true of all ML algorithms of course. For example, autoregressive models like LSTMs can have inputs of varying dimensionality. ↩
-
Specifically, the minimum of the age-based minimums, the maximum of the age-base maximums, and the average of the age-base midpoints. ↩
-
Note that change in the level contribution is a function of the order. For example, if “Exonic” were to come before “NCBI” on the graph, then it is completely possible the numbers could be different. The x-axis was ordered to reflect the flow of data through the processing pipeline. ↩