
SurvSet: An open-source time-to-event dataset repository
This post summarizes a newly released python package: SurvSet the first ever open-source time-to-event dataset repository. The goal of SurvSet is to allow researchers and practioneeres to benchmark machine learning models and assess statistical methods. All datasets in this repository are consisently formatted to enable rapid prototyping and inference. The origins of this dataset were for testing regularity conditions of the False Positive Control Lasso.
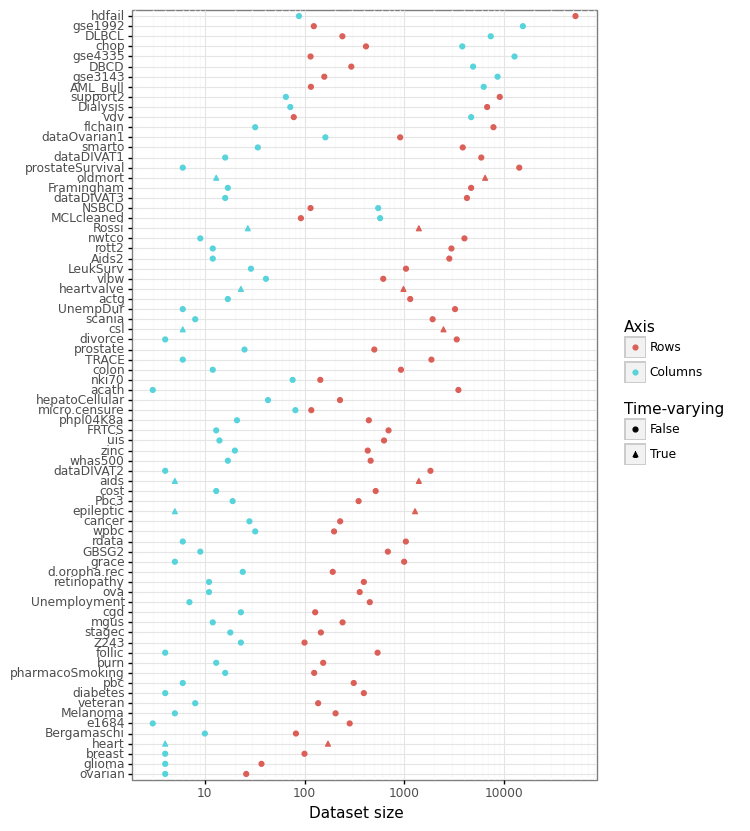
While SurvSet is designed for python, the formatted datasets can found in a comma-separated format within this folder. SurvSet currently has 76 datasets which vary in dimensionality (see Figure 1 below). This includes high-dimensional genomics datasets (p » n) like gse1992, and long and skinny datasets like hdfail (n » p).
Installation
SurvSet can be installed using pip for python3: pip install SurvSet. You can run python3 -m SurvSet to make sure the package has compiled without errors. Please note that pandas and numpy will be installed as dependencies (see PyPI for more details).
Dataset structure and origin
Most of SurvSet’s datasets come from existing R packages. The accompanying arXiv paper provides a full list of package sources and references. Datasets can be called in from the main class SurvLoader with the load_dataset method. This will return a pandas DataFrame with the following columns structure:
pid: the unique observation identifier (especially relevant for time-varying datasets)event: a binary event indicator (1==event has happened)time: time to event/censoring (or start time iftime2exists)time2: end time [time,time2) if there are time-varying featuresnum_{}: prefix implies a continuous featurefac_{}: prefix implies a categorical feature
Currently 7 datasets have time-varying features. Some datasets will have the same feature a both a continuous and categorical feature. This was done for those features that are plausibly ordinal.
Figure 1: Dataset dimensionality
Usage (simple)
This code block shows how to access the list of available datasets and thir aliases .df_ds, and loads the ova dataset and its reference.
from SurvSet.data import SurvLoader
loader = SurvLoader()
# List of available datasets and meta-info
print(loader.df_ds.head())
# Load dataset and its reference
df, ref = loader.load_dataset(ds_name='ova').values()
print(df.head())
Usage (complex)
The example below shows a simple machine learning pipeline that fits a series of ElasticNet CoxPH models to each of the (non-time-varying) datasets. To make run the code, please install the appropriate packages: conda install -c bcg_gamma -c conda-forge scikit-learn=1.0.2 sklearndf=2.0 scikit-survival=0.17.0 plotnine=0.8.0.
import os
import numpy as np
import pandas as pd
import plotnine as pn
from SurvSet.data import SurvLoader
from sksurv.util import Surv
from sksurv.metrics import concordance_index_censored as concordance
from sksurv.linear_model import CoxnetSurvivalAnalysis
from sklearn.model_selection import train_test_split
from sklearn.compose import make_column_selector
from sklearndf.pipeline import PipelineDF
from sklearndf.transformation import OneHotEncoderDF, ColumnTransformerDF, SimpleImputerDF, StandardScalerDF

# (i) Set up feature transformer pipeline
enc_fac = PipelineDF(steps=[('ohe', OneHotEncoderDF(sparse=False, drop=None, handle_unknown='ignore'))])
sel_fac = make_column_selector(pattern='^fac\\_')
enc_num = PipelineDF(steps=[('impute', SimpleImputerDF(strategy='median')), ('scale', StandardScalerDF())])
sel_num = make_column_selector(pattern='^num\\_')
# Combine both
enc_df = ColumnTransformerDF(transformers=[('ohe', enc_fac, sel_fac),('s', enc_num, sel_num)])

# (ii) Run on datasets
alpha = 0.1
senc = Surv()
loader = SurvLoader()
ds_lst = loader.df_ds[~loader.df_ds['is_td']]['ds'].to_list()  # Remove datasets with time-varying covariates
n_ds = len(ds_lst)
holder_cindex = np.zeros([n_ds, 3])
for i, ds in enumerate(ds_lst):
    print('Dataset %s (%i of %i)' % (ds, i+1, n_ds))
    anno = loader.df_ds.query('ds == @ds').T.to_dict()
    anno = anno[list(anno)[0]]
    df, ref = loader.load_dataset(ds).values()
    # Random stratified split
    df_train, df_test = train_test_split(df, stratify=df['event'], random_state=1, test_size=0.3)
    # Fit encoder
    enc_df.fit(df_train)
    # Sanity check
    cn_prefix = enc_df.feature_names_original_.str.split('_',1,True)[0].unique()
    assert all([cn in ['fac', 'num'] for cn in cn_prefix])
    # Prepare numpy arrays
    X_train = enc_df.transform(df_train)
    So_train = senc.from_arrays(df_train['event'].astype(bool), df_train['time'])
    X_test = enc_df.transform(df_test)
    # Fit model
    mdl = CoxnetSurvivalAnalysis(normalize=True)
    mdl.fit(X=X_train, y=So_train)
    scores_test = mdl.predict(X_test)
    res_test = df_test[['event','time']].assign(scores=scores_test)
    So_test = senc.from_arrays(res_test['event'].astype(bool), res_test['time'])
    conc_test = concordance(So_test['event'], So_test['time'], res_test['scores'])[0]
    # Get concordance and 90% CI
    n_bs = 250
    holder_bs = np.zeros(n_bs)
    for j in range(n_bs):
        res_bs = res_test.groupby(['event']).sample(frac=1,replace=True,random_state=j)
        So_bs = senc.from_arrays(res_bs['event'].astype(bool), res_bs['time'])
        conc_bs = concordance(So_bs['event'], So_bs['time'], res_bs['scores'])[0]
        holder_bs[j] = conc_bs
    lb, ub = np.quantile(holder_bs, [alpha,1-alpha])
    holder_cindex[i] = [conc_test, lb, ub]

# (iii) Merge results & plot
df_cindex = pd.DataFrame(holder_cindex, columns=['cindex', 'lb', 'ub'])
df_cindex.insert(0, 'ds', ds_lst)
ds_ord = df_cindex.sort_values('cindex')['ds'].values
df_cindex['ds'] = pd.Categorical(df_cindex['ds'], ds_ord)

gg_cindex = (pn.ggplot(df_cindex, pn.aes(y='cindex',x='ds')) +
    pn.theme_bw() + pn.coord_flip() +
    pn.geom_point(size=2) +
    pn.geom_linerange(pn.aes(ymin='lb', ymax='ub')) +
    pn.labs(y='Concordance') +
    pn.geom_hline(yintercept=0.5,linetype='--', color='red') +
    pn.theme(axis_title_y=pn.element_blank()))
gg_cindex
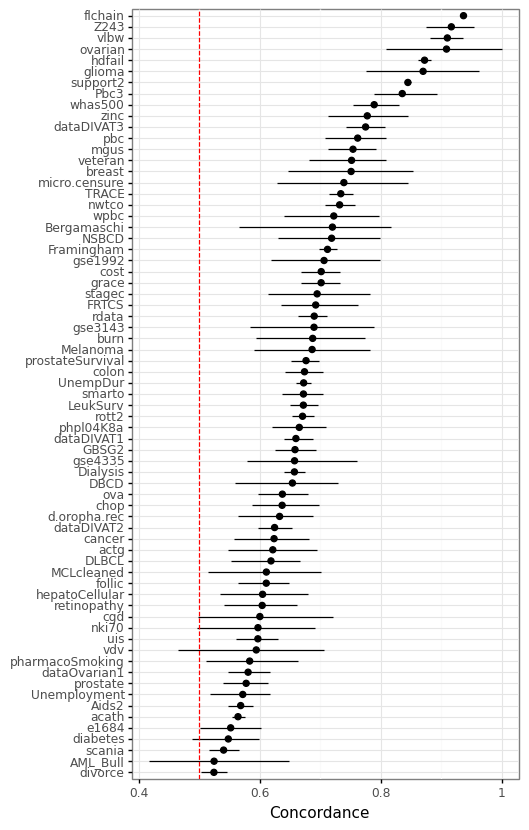
Figure 2 below shows the concordance score (also known as the c-index) on the randomly held out test set (30% of the data). The model is the CoxnetSurvivalAnalysis from scikit-survival with default settings.
Figure 2: Concordance of a regularized linear model
Adding new datasets
If you are interested in contributing to SurvSet or know of other open-source time-to-event datasets you think would be useful additions, please contact me. If you would like to see these datasets adopted quickly, please directly modify the data generating process found in SurvSet/_datagen/pipeline.sh and create a pull request.
How to cite
If you use SurvSet in your research or project please cite the following:
@article{drysdale2022,
  title={SurvSet: An open-source time-to-event dataset repository},
  author={Drysdale, Erik},
  journal={arXiv preprint arXiv: 2203.03094},
  year={2022}
}