
Shorting the Canadian housing market with REITs
(1) Executive summary
This post considers how well the Canadian housing market can be shorted (i.e. bet against) using publicly traded equities such as real estate investment trusts (REITs). There are structural reasons why the Canadian housing is difficult for investors to short:
- Between cities, house price changes are imperfectly correlated (~32%)
- Within a city, price changes vary by housing type (i.e. apartment vs detached)
- REITs derive most of their value from net operating cash flow, rather than the price of land (which is the main factor affecting housing affordability)
- No financial instruments exist which track a quality-adjusted housing price index.
However, for investors interested in betting against house price declines in Toronto, a historically evaluated shorting strategy is able to obtain a 1% return, on average, within 30 days. This strategy assumes investors make short sales against a basket of equities the day after the Toronto house price index posts a month-on-month price decline. A similar strategy for either the Vancouver or national market is less effective.
All figures used in this post were generated with publicly available data and all analysis can be reproduced by cloning this repo and following the instructions in the README. Please note, I hold positions on some of the equities discussed in this post, and investors should conduct their own due diligence before making any financial decisions. This post will not speculate on whether the Canadian housing market is a “bubble”. I also avoid discussion matters of public policy, which I have discussed elsewhere (see here, here, and here).
(2) Canadian housing market backgrounder
One unintended consequence of the COVID-19 crisis has been the strong growth of house prices in developed markets. House prices have grown, year-over-year, by 32% in New Zealand, 7.5% in Australia, 10% in England, and 13% in the United States. Canada is leading the pack with a 38.4% year-over-year price changes as of May 2021. The cause has been simple: a sudden shift in the demand curve for housing space to accommodate remote work.[1] In retrospect, this surge in demand is not surprising, although we can easily forgive those who forecast a decline in prices when the crisis started given that mass remote work was an untested proposition. These changing preferences also mean de-densification, and help explain why prices for single-family homes are rising at three times the rate of apartments. Historically, de-densification was driven by income gains and transportation improvements which increased demand for square footage and reduced commuting times.[2] Remote work can be thought of as a type of reduced commuting time.
While COVID-19 may be the death knell of housing affordability in many cities, almost all of the country’s large urban centres have seen decades of above-inflation house price growth. Canada is a largely urban country (82%) and the majority of job growth has taken place in a handful of cities. Figure 1 below shows the share of net employment and population growth that has occurred in the Greater Toronto & Hamilton (GTAH) area along with Greater Vancouver & Victoria. Almost half of net population growth occurs in these two regions, and in some years more than half of all new jobs. With the inclusion of Calgary, Edmonton, and Montreal, these cities account for the bulk of all new job opportunities in Canada.
Figure 1: Employment and population growth in Greater Toronto and Southwestern BC
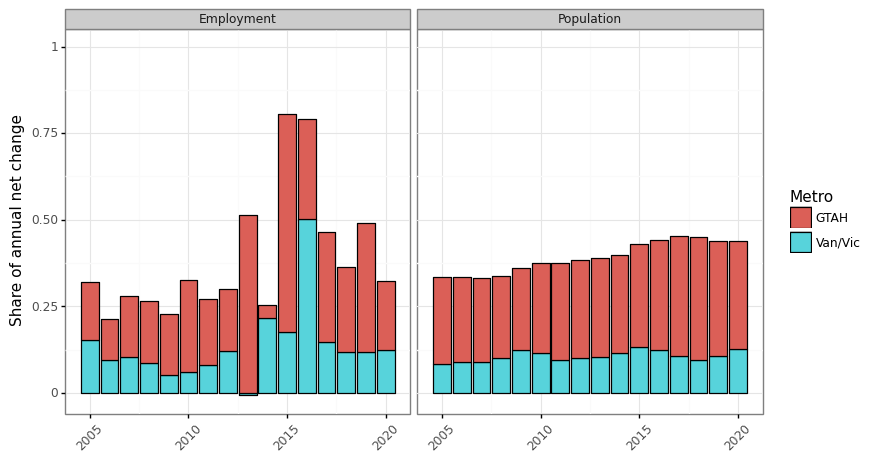
Unfortunately for many workers, and especially those who rent, surging house prices have effectively wiped out all labour market benefits from moving these municipalities. As the average renter spends anywhere from 29-36% of their income on rent, rental prices increases of 5-15% are enough to wipe out real wage increases.[3] Since 2000 most residential house prices and rents in Canada have become sufficiently volatile and disconnected from local labour markets that housing costs have become the equivalent of a foreign currency for renters.[4] Figure 2 shows that house prices have gone up by 100-250%, depending on the Canadian city, since 2005 (an annualized rate of roughly 5-9%).
Figure 2: Canadian housing prices by region and type
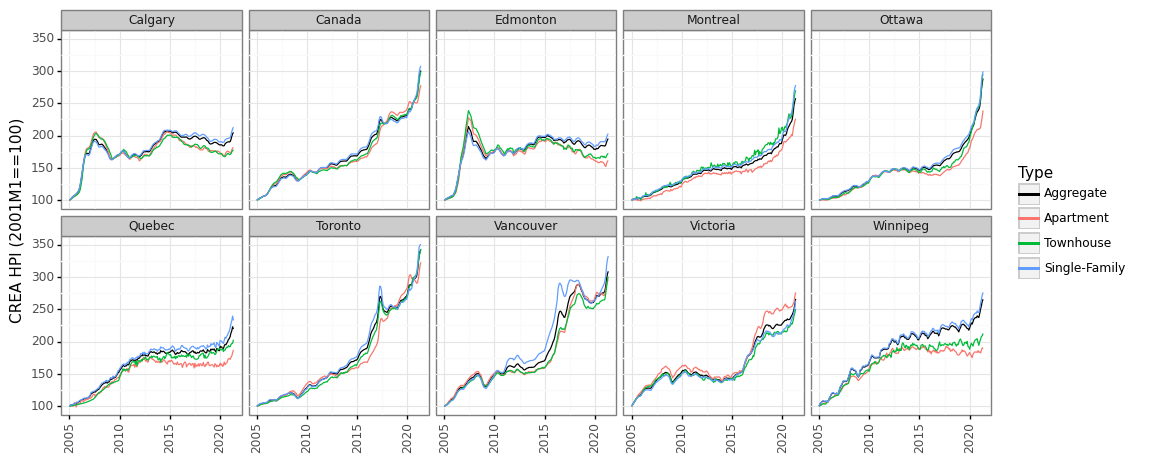
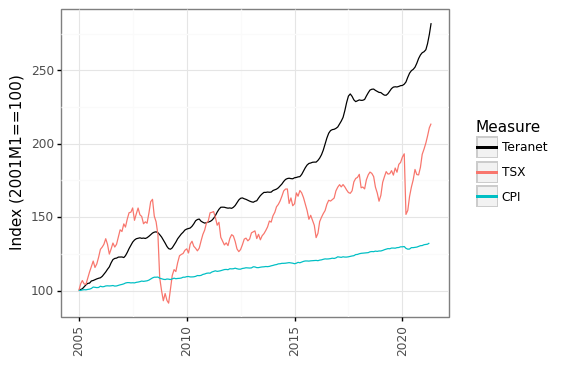
In contrast, the consumer price level has increased by at most 50% in this time period, and owning shares in Canada’s blue chip companies, while profitable, has been much less lucrative (Figure 3).
Figure 3: Canadian HPI (Teranet) vs CPI vs TSX
(3) Housing as an investment
Housing is a horrible investment vehicle in theory. An ideal asset is 1) liquid, 2) diversified, and 3) uncorrelated with other income streams. Residential real estate fails to satisfy all three of these properties. Housing is difficult to sell and has a large transaction cost (illiquid). It is a single-asset class (undiversified). Assuming you are employed in the city you live in, a housing market slump will likely be associated with local economic shocks which imply an increased probability of unemployment.
Investing 101 says that owning a single stock is a bad idea. Even though a given company could see its share price increase by 30% in a given year, it could also fall by a large amount. In contrast, owning ten stocks in ten different sectors will reduce the probability of a large price increase or decrease.[5] The same principle applies to owning a house. Even if a city’s house price growth was stable in aggregate, within a neighbourhood there can be large price swings due to re-zoning, gentrification, natural disasters, construction projects, and many other forces.
Housing markets also share the unfortunate characteristic that they are highly cyclical. When the local economy is doing well prices will go up. But if a local industry collapses then workers will lose their jobs, housing prices will fall, and a cascade of defaults can occur. One of the reasons for the 2008 financial crisis was the large amount of leverage that the banking sector took on. A 10% equity stake in a home means you are levered 9:1. At this ratio, a 10% price increase yields a 100% return on investment whereas a 10% price decline means your down payment is wiped out. Leverage therefore magnifies returns.
However, two-thirds of Canadian households own their house and more than 80% think home ownership is a good investment. Why is there a disconnect between economic theory and what real people actually want to invest in? One reason might be culture. In North America the real estate industry has turned home ownership into a cultural good that signifies middle-class respectability. The power imbalance between tenants and landlords may also create a yearning for independence via ownership. COVID-19 has further reinforced the view that an owner-occupied home can be one’s castle. Many people believe that paying rent amounts to “throwing away money” whereas payments against a mortgage are a tool to build equity. Housing is also tied up with family, marriage, and many other factors that are hard to disentangle from pecuniary interests. The fact that wealthy societies like Switzerland and Germany have home ownership rates below 55% suggests that cultural forces may a factor. I am more inclined to believe that policy is the demand-side culprit. First, and most crucially, a Canadian taxpayer’s principal residence is excluded from capital gains tax. Whereas an RRSP or TFSA account has limits on the amount of tax-free earnings that can be sheltered in Canada, no such limit exists for the primary residence. As a result, literally hundreds of billions of dollars of capital gains have gone untaxed in the last twenty years.
Given that a first-time buyer in Vancouver or Toronto would need to obtain a mortgage of more than a million dollars to buy a semi-detached house, or more than half-a-million for a condo, it is not surprising that many are reluctant to jump into the property market. However the fear of waiting too long and being priced out of the market is not unreasonable given the empirical data in the last 20 years. For Canadian households which have been observing these price changes the psychological effects have been profound. The fear of missing out means that Canadian households are more willing to leverage themselves to get large mortgages. Canada’s household debt-to-income ratio is 177%, putting our country near the top in world comparisons. Most of this household debt, unsurprisingly, is made up of mortgages (65%). Even though renters do not necessarily experience higher rents in any given year because of rent controls and the stickiness of contracts, in the long run rents will necessarily rise since rental units can ultimately be resold as condos for homebuyers and investors. For example, CMHC reports that rental prices rose by 5.7%, 6.5%, and 6.0% in 2019, for Montreal Toronto, and Vancouver, which was close to the increase in property prices.[6] In other words house price increases will always catch up with renters in the long run.
Canadian households interested in owning a home, or existing homeowners wishing to protect their home equity, can both benefit from a hedging strategy. For those not yet in the market, a hedge amounts to owning an investment whose values will go up (or down) if the price of housing goes up (or down). Conversely, those wishing to insulate themselves from losing home equity may want an investment whose value goes up (or down) when the price of housing goes down (or up). The next two sections of this post discuss the investment options that exist, and their technical performance in terms of hedging. While my primary focus is on shorting (i.e. betting against) the housing market, it should be clear that some stocks are better than others at tracking the Canadian housing market.
(4) REITs and other housing-related equities
Real estate investment trusts (REITs) are often touted as the best vehicle for tracking the housing market. A REIT is a type of trust structure that allows companies to avoid paying corporate income tax if they pass their net income to shareholders. These companies are usually debt-financed, and purchase a portfolio of residential and/or commercial properties, and earn money for shareholders by renting them out above the cost of financing and management. Hence, REITs are popular as a passive income vehicle since they tend to pay monthly dividends, and usually at a favourable rate. There are at least 40 publicly tradeable REITs on the Toronto Stock Exchange (TSX), and I use up to 38 of them in my analysis.
Unfortunately, for an investor wishing the hedge against residential real estate prices, REITs are an imperfect vehicle for three reasons.
- They often own commercial properties
- The location of their real estate assets will vary
- Their value is primarily derived from future cash flow, and not the land prices
For example, during the COVID-19 crisis, the value of REITs fell precipitously and only recently recovered. This makes sense because reduced household and business incomes reduced the market rate for rents. REITs are not designed to speculate on the value of land, which is what drives most of the cost of residential real estate. Furthermore, residential REITs almost exclusively rent out apartment units, which may or may not track the price of detached houses.
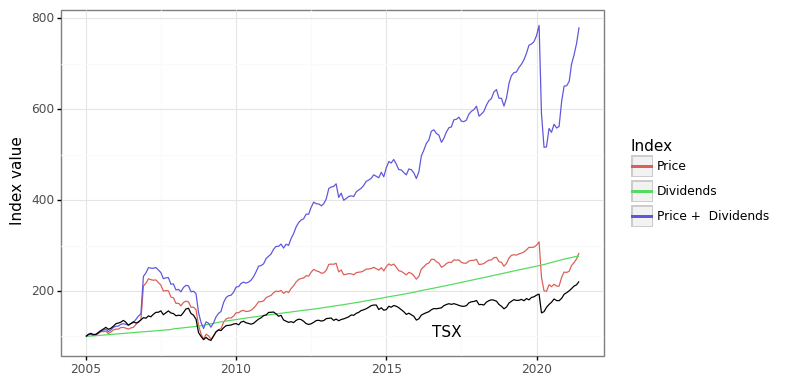
However, as an asset class REITs have done very well in the last 15 years. The return from either capital gains, or dividends, separately, was enough to beat the S&P/TSX Composite index. When combined, the compound growth has been staggering (Figure 4). However, the number of REITs in this index remains small, ranging from 13 in 2005 to 35 in 2021. Randomizing allocations to this index reveals the magnitude of variation. Owning REITs would have easily kept pace with Canada’s housing prices. This does not necessarily mean that REITs are structurally correlated with house prices, as will be discussed in the next section.
Figure 4: Canadian REIT index
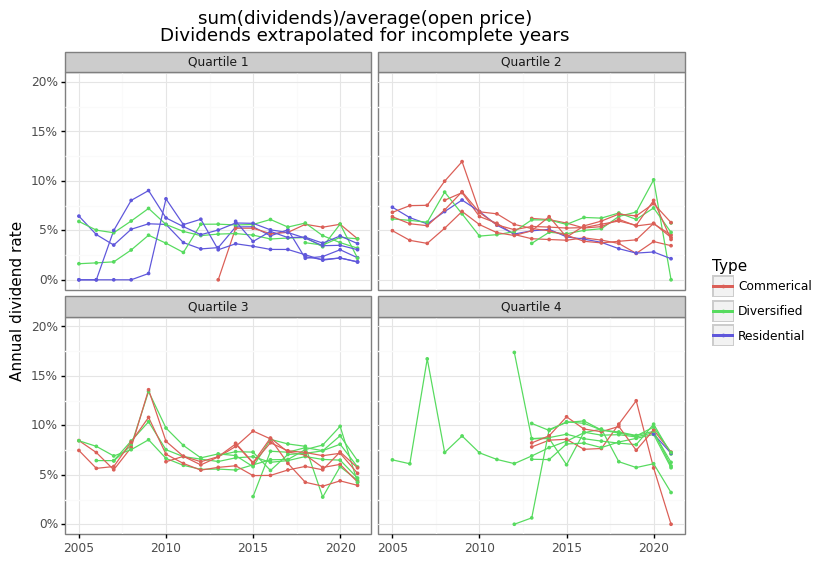
REITs share the advantage of other stocks in that they are liquid. Similar to ETFs, they also hold a portfolio of assets which helps to reduce their downside risk. They are well suited to being held in an RRSP or TFSA account where such dividends can be accumulated tax free and re-invested without penalty. Individuals that rent their apartment from a publicly traded REIT may want to consider owning the stock as a partial hedge against future rent increases. Even in 2021 with interest rates close to zero, the average REIT is still paying a generous dividend rate of 5% of more (Figure 5).
Figure 5: Canadian REIT dividend rate
Headlines that Wall Street insiders are betting against Canada’s housing market almost always implies they are betting against Canada’s largest banks (TD, RBC, Scotia, etc). This is horrible shorting strategy for the simple reason that Canada’s major banks have almost no mortgage default risk. Residential mortgage origination in Canada falls into one of two categories: insured and uninsured mortgages. If you purchase a house with less than a 20% down payment, you are required to get mortgage insurance, which transfers the risk of mortgage default from the bank making the loan to one of three mortgage insurers in Canada: i) Canada Mortgage and Housing Corporation (CMHC), ii) Canada Guaranty Mortgage Insurance Co., or iii) Sagen MI Canada. CMHC is a crown corporation and has the implicit backing of the federal government, Guaranty is privately owned by the Ontario Teacher’s Pension Plan (and probably has the backing of the provincial government), whereas Sagen MI is publicly tradeable (but has the smallest market share). An investor’s best hope to profit from residential mortgage default risk is limited to Sagen. Though many banks hold uninsured mortgages, these have an equity buffer of at least a 20%, and are usually held by the highest quality borrowers.
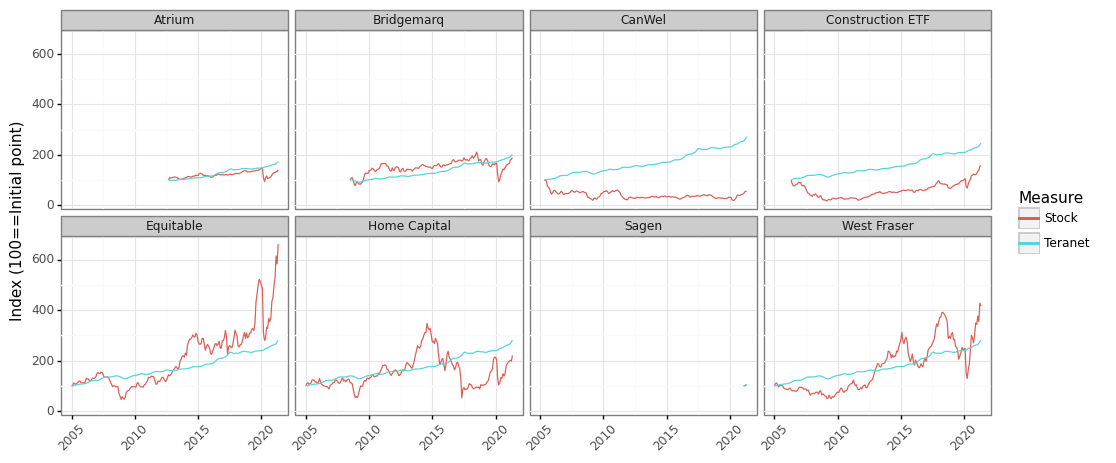
Besides REITs and Sagen, are there other stocks that might track housing prices? I identified several. Bridgemarq Real Estate Services (BRE.TO) derives most of its revenue from services provided to realtors. Since realtor’s income tracks house prices, this is a reasonable housing play. Equitable Group Inc. (EQB.TO), Home Capital Group Inc. (HCG.TO), and Atrium Mortgage Investment Corporation (AI.TO) are all alternative mortgages lenders and have the lowest quality mortgages on their books. Although with mortgage insurance and securitization it is difficult to assess their underlying credit risk. However, Home Capital’s flirtation with bankruptcy in 2017 suggests these lenders will be the first to go under, if anyone does. Another category of investments that may experience fallout from a post-COVID housing downturn are home builders and material providers. West Fraser Timber Co. (WFG.TO), CanWel Building Materials Group Ltd. (CWX.TO), and iShares U.S. Home Construction ETF (ITB) will likely ride the fortunes of the price of a 2x4. Unfortunately, as Figure 6 below shows, none of these stocks shows a long-run price correlation with national house prices in Canada.
Figure 6: Other housing-related equities
(5) Shorting the Canadian housing market
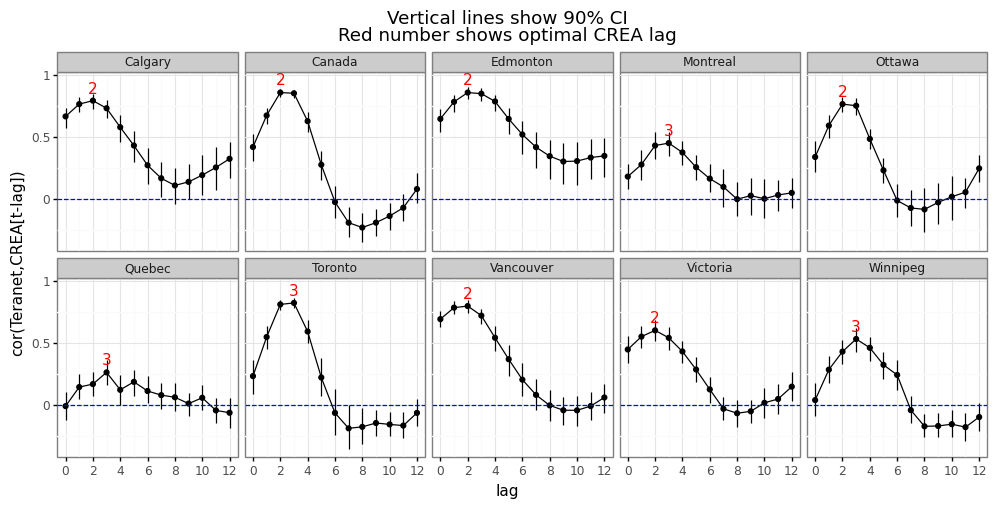
The quantitative index that most closely aligns to Canadians’ housing market experiences is a quality-adjusted house price index (HPI). There are two such indices in Canada: the CREA HPI and Teranet. Teranet uses a repeat sales methodology, which only measures price changes for the same house that has been sold at different time points. CREA’s approach is slightly more complicated and hedonically adjusts for different housing characteristics. While Teranet’s methodology is probably more robust, it is a lagging indicator because it uses data from the land registry, and there is a time lag between the purchase price and closing. Statistical estimates suggest that Teranet lags CREA by around 2-3 months, depending on the city (see Figure 7).
Figure 7: Month-on-month % lead/lag comparison
Unfortunately, there is no financial instrument that tracks either of these Canadian HPIs. There could be significant benefit to Canadians if housing futures were available for these indices, the way they are for some cities in the United States. Even if such options did exist and were traded in a liquid market, a homeowner wishing to hedge their investment would experience several challenges. First, as Figure 2 showed, housing prices will vary by type, even within the same city (i.e. apartments versus detached homes). Second, the duration of the financial instrument may not align. For example, shorting positions will be subject to margin calls, so that an investor will be forced to liquidate a position before they can realize a profit. Third, the length of the contract may differ from the period of occupancy. Many homeowners will want to hold positions for at least five years to match the term of a mortgage.
How can the equities outlined in section (4) be used to bet against (or short) the housing market? Retail investors will have two choices: 1) direct short selling (i.e. borrowing equities) or 2) purchasing options like puts. Short selling is fundamentally more risky because you have to re-purchase the stock at a future price, and the price of a stock has no upper bound. However, short selling comes with no upfront cost beyond some small fees and the borrowing interest rate your brokerage account charges.[7] In contrast, the purchase price of a put is the most amount of money you can possibly lose. These option get their value when the price of an equity goes below the “strike price,” which gives you the right to sell the equity at an inflated price and pocket the difference. Naturally, the closer the strike price is the current market price, the more expensive the put will be. It is up to each individual investor to determine whether short sales or puts are more appropriate for their financial needs.
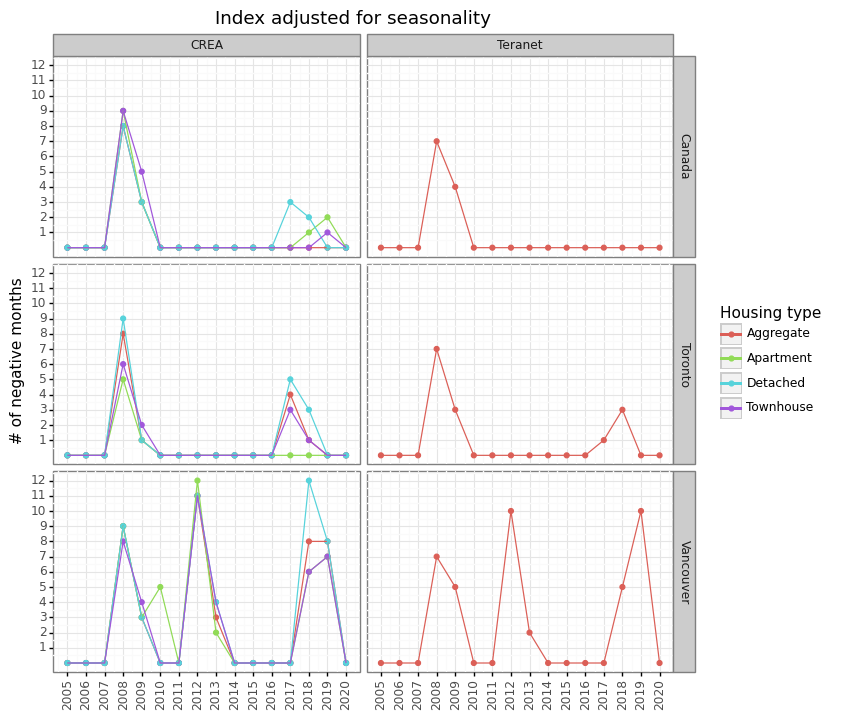
For the rest of this section I will outline the shorting strategy used to determine whether money can be made from short-term downswings in house prices for Toronto, Vancouver, or the national market generally. There is a myth that house prices never decline in Canada. This is simply not true, as Figure 8 shows. All regions saw price declines during the financial crisis in 2008-2009. Vancouver saw further price declines in 2012-13 and then again in 2018-19 after the introduction of a speculation tax. Toronto saw a modest pull-back in 2017-18 after the introduction of a different speculation tax. Canada as a whole has been the most immune to downturns, with declines in Toronto or Vancouver being partially offset by other markets.
Figure 8: When have house prices prices declined?
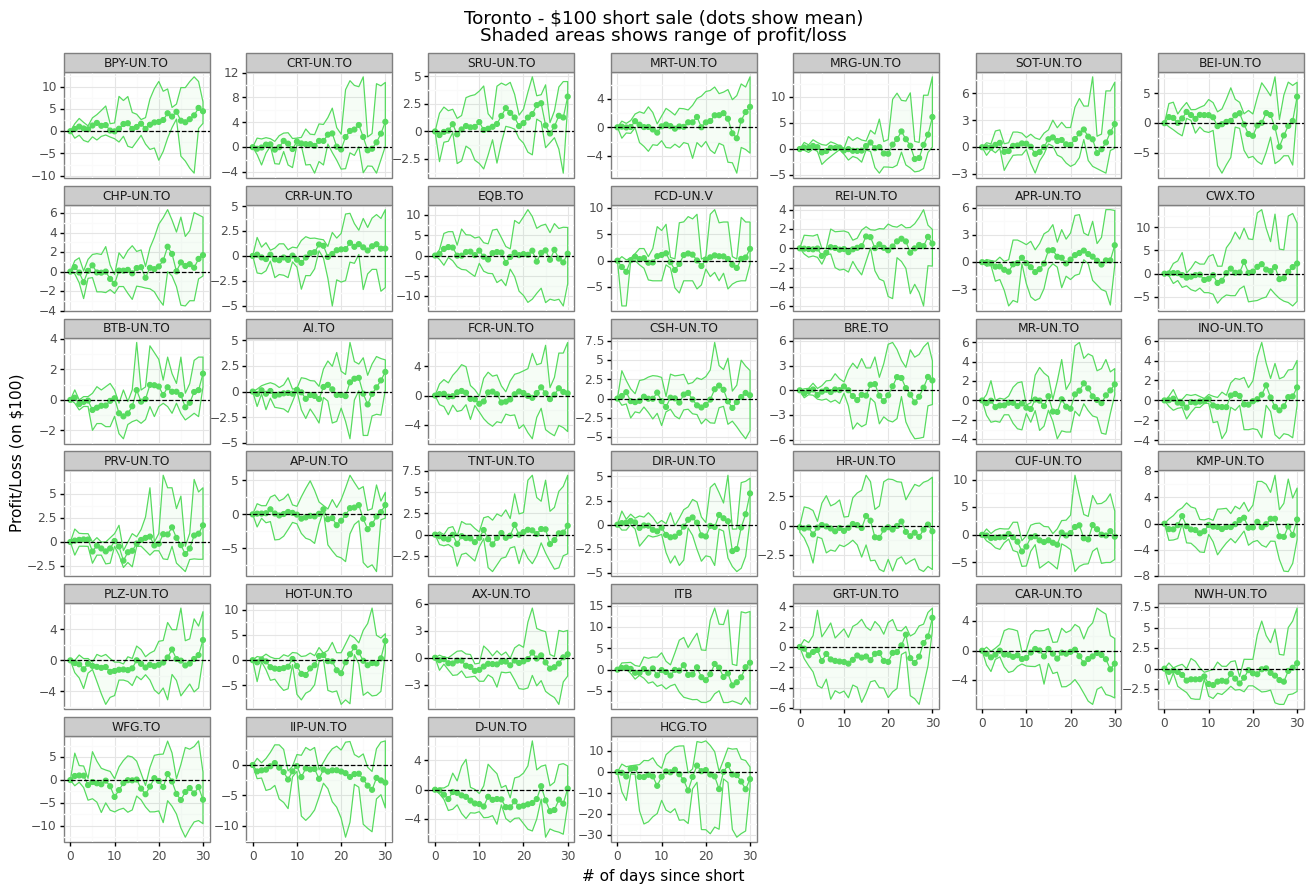
A reasonable strategy is to take short positions against a group of equities for months in which the CREA HPI posts a negative (seasonally adjusted) month-over-month price decline. Using the CREA HPI release dates since 2010, a $100 short position in each of the stocks discussed in section (4) is taken when the regional HPI posts a monthly price decrease. I chose to avoid the great recession since all asset prices saw a downturn during this period. In the case of Toronto, a handful of stocks are able to obtain a modest average shorting profit after 30 days (Figure 9). These include Brookfield Property Partners (BPY), Canadian Tire REIT (CRT), SmartCentres REIT (SRU), Morguard REIT (MRT), and Morguard North American Residential (MRG). BPY and MRT contain a mixture of property types, CRT and SRU are exclusively commercial, and MRG is is exclusively residential.
Figure 9: Shorting success for the Toronto HPI
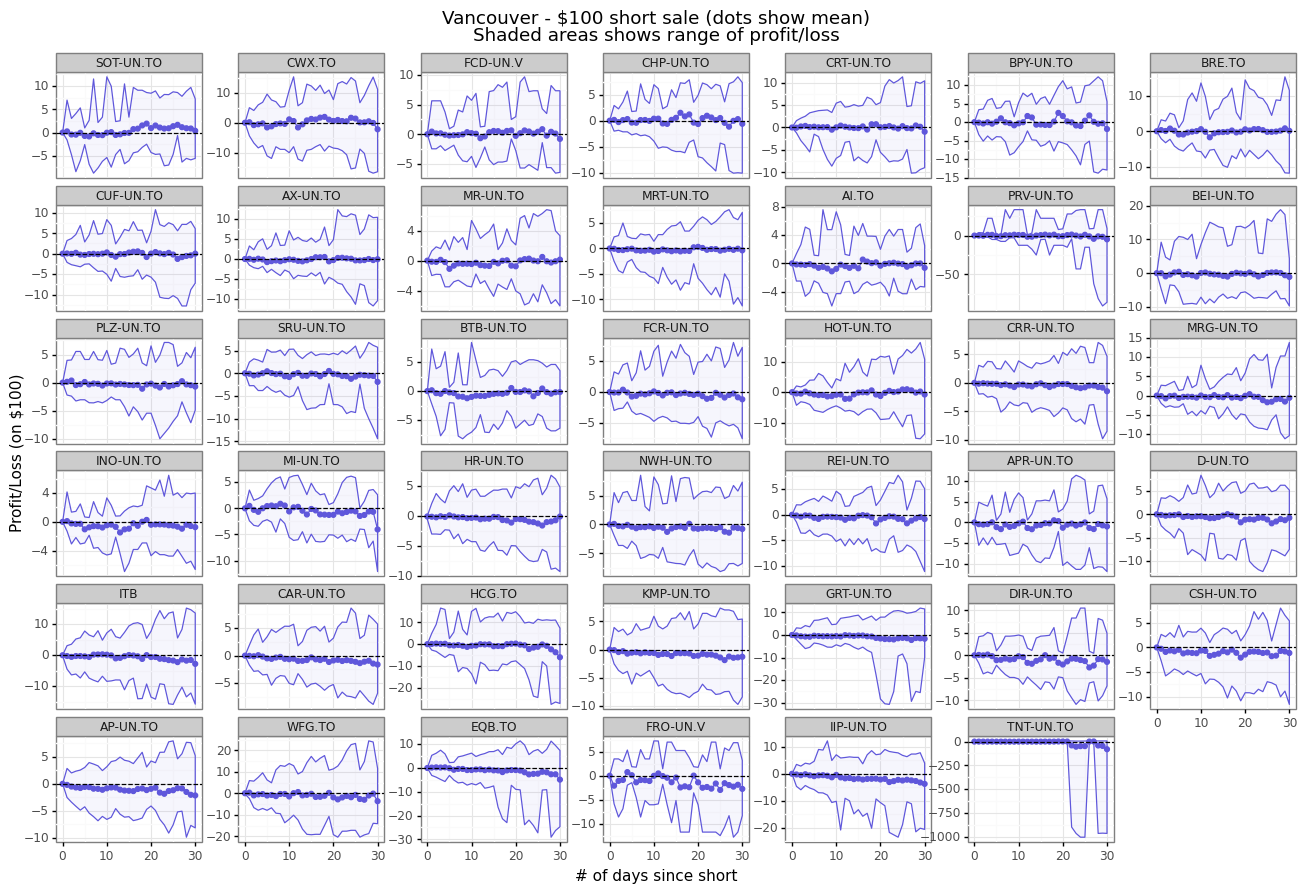
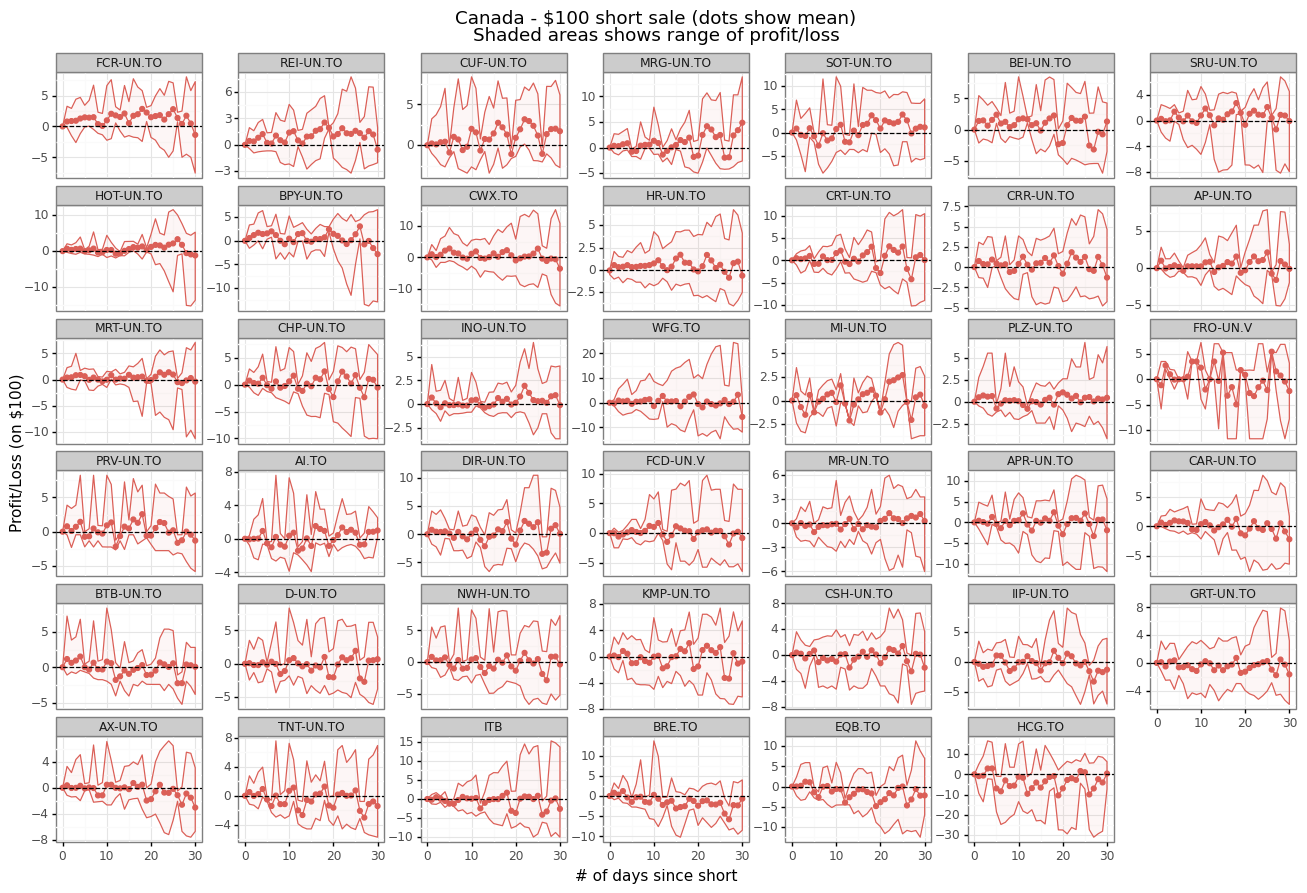
Equivalent figures for Vancouver and Canada show even less signal. Shorting more than one equity is able reduce the variance of the profits and losses, although at the expense of an overall return (Figure 10). Although the range of profit and losses for Vancouver is so large as to make the average profit almost meaningless.
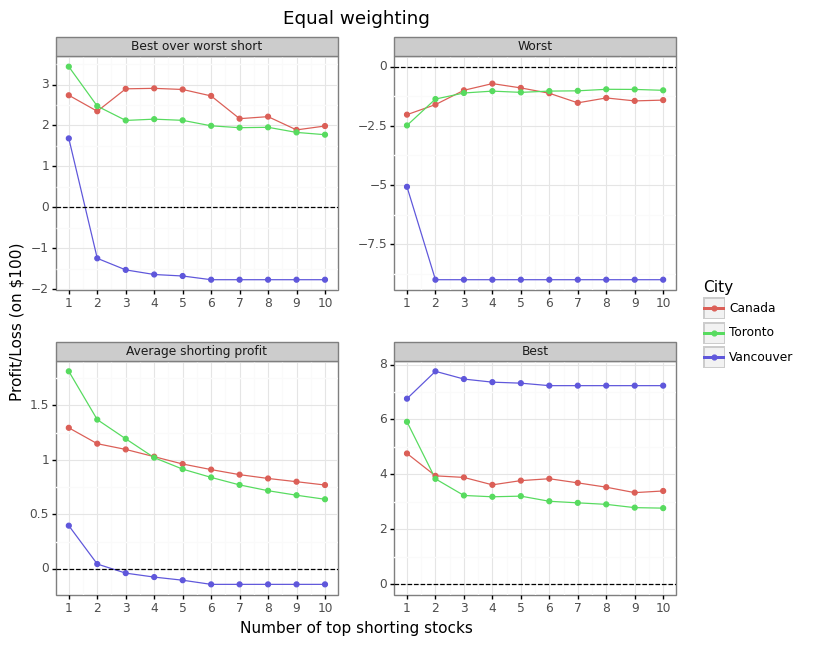
Figure 10: Holding multiple short positions
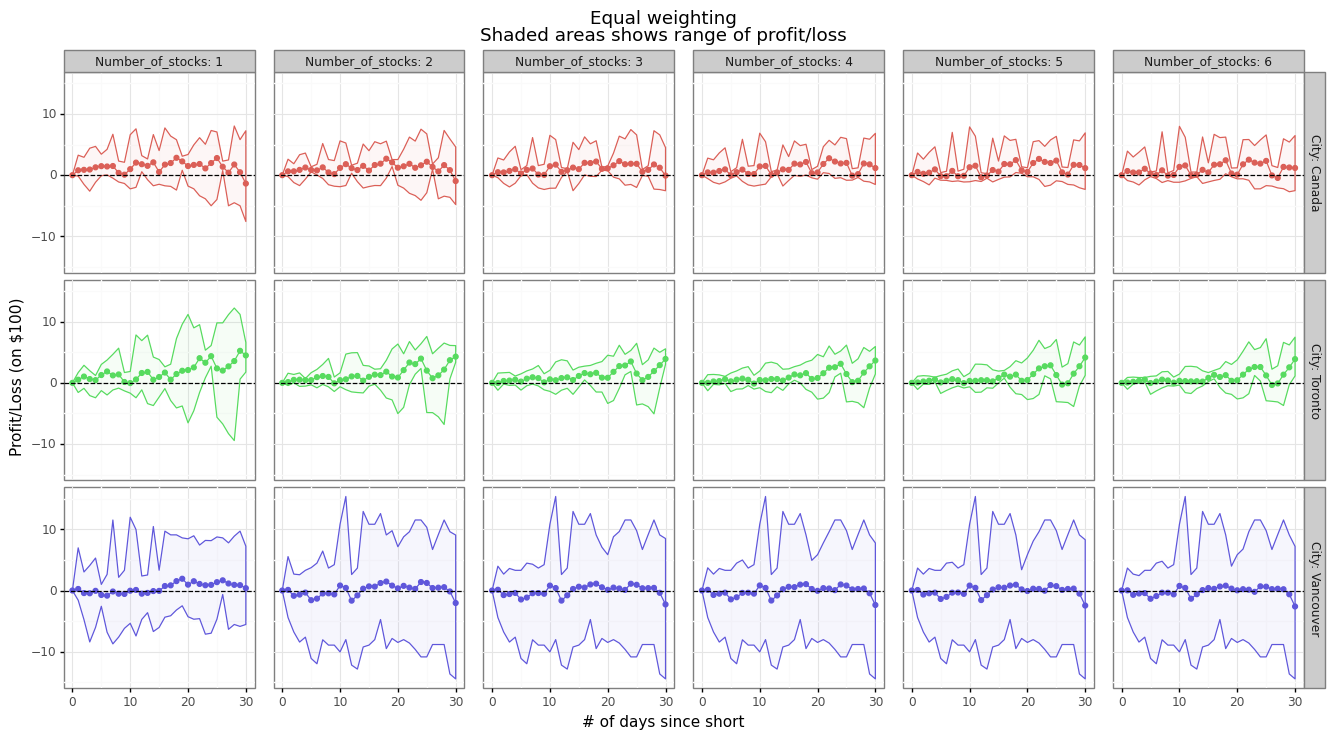
While using the best five instead of the top ranked stock lowers the average shorting return from \$1.6 to \$1 for Toronto, it also reduces the downside risk from \$2.5 to \$1 (Figure 11). This suggests that shorting a small number of stocks is worth the bias-variance trade-off.
Figure 11: Trade-offs for holding multiple short positions
(6) Conclusion
There appears to be a modest historical relationship between price declines in the Toronto CREA HPI and price declines in a handful of REITs. The same REITs have an even weaker signal with Canada as a whole. The Vancouver HPI appears too volatile and idiosyncratic for equities to be useful hedges. Of course, these relationships are based on the small number of times the housing market has declined in these jurisdictions. The run-up in house prices because of COVID-19 may be sui generis. It is completely conceivable that rental prices will rise (benefiting REITs) even as house prices decline due to housing preferences reverting to a pre-pandemic state. Alternatively, prices may crash for the likes of Equitable, Home Capital, and Atrium if investors begin to question their underwriting standards. Until Canadian investors are able to directly short the CREA or Teranet HPIs, betting against the Canadian housing market will be a challenging task.
References
-
And possibly to accommodate all of those new pets we’ve been adopting. ↩
-
For example, Manhattan’s density has halved since its peak in 1910. A similar phenomenon can be seen in Victorian London and Paris. Before motorized vehicles were common, workers had to walk to their place of employment and placed a higher premium of living in the downtown core where the sources of employment were. ↩
-
When I refer to “real” prices I am referring to the CPI-deflated prices as defined by Statistics Canada. ↩
-
Local wage and residential house prices changes are correlated, but for most individuals the correlation will be sufficiently small that this is an insufficient insurance mechanism (with the possible exception of real estate agents). ↩
-
The magnitude of the decrease will vary by the distribution. For example, if stock price returns followed a normal distribution, then owning 10 uncorrelated stocks would reduce a two-standard deviation change by a factor of 200: $\Phi(-1)/\Phi(-\sqrt{10})$. Even if a stock price followed an exponential distribution (which has fatter tails) the decrease in probability would be by a factor of almost 7000 (
pexp(3,lower.tail = F)/pgamma(q=3*10,shape=10,rate=1,lower.tail = F)! ↩ -
The respective Teranet price changes in 2019 were 6.1%, 5.3%, and 0.6%, respectively. ↩
-
For example TD charges an annual interest rate of 4% on margin balances. ↩